Figures & data
Table 1. The association between ZFPM2-AS1 expression and clinicopathologic parameters in glioma patients
Figure 1. ZFPM2-AS1 knockdown inhibited the tumorigenesis of glioma. (a) ZFPM2-AS1 expression in glioma tissues and matched control tissues by RT-qPCR. (b) ROC curve analysis was used to assess the diagnostic values of the circCSNK1G1. (c) ZFPM2-AS1 expression in glioma cell lines and control cell line (NHA) by RT-qPCR. (d) RT-qPCR analysis of ZFPM2-AS1 expression in A172 and LN229 cells transfected with sh-ZFPM2-AS1#1 and sh-ZFPM2-AS1#2. (e) CCK-8 assay was performed to detect A172 and LN229 cell viability upon ZFPM2-AS1 knockdown. (f) The proliferation of ZFPM2-AS1-downregulated A172 and LN229 cells was evaluated via colony formation assay. (g) Flow cytometry analysis for cell cycle detection in sh-ZFPM2-AS1#1/2 group or sh-NC group. (h) Cell apoptosis after ZFPM2-AS1 deficiency was testified through TUNEL assay. *p < 0.05, **p < 0.01
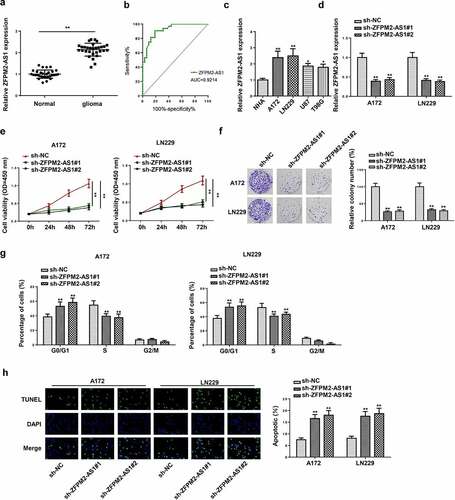
Figure 2. Effect of ZFPM2-AS1 in glioma tumorigenesis. (a) The tumors excised from mice in sh-ZFPM2-AS1#1 group or sh-NC group. (b and c) The tumor volume and weight were confirmed in ZFPM2-AS1-knockdown group and control group. (d) Function of silenced ZFPM2-AS1 on Ki-67 expression was confirmed by IHC assay. **p < 0.01
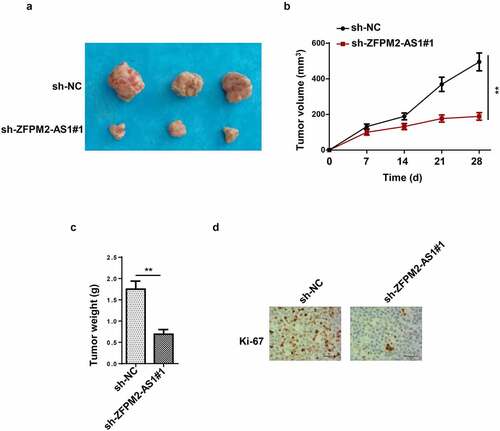
Figure 3. SP1 transcriptionally activated ZFPM2-AS1 expression. (a) The DNA motif of SP1 and its binding site with ZFPM2-AS1 promoter. (b) ChIP assay was used to confirm the enrichment of ZFPM2-AS1 promoter in the beads conjugated with anti-SP1 or anti-IgG. (c) RT-qPCR was applied to detect oe-SP1 transfection efficiency. (d) Luciferase reporter assay was adopted to prove the interaction of SP1 with ZFPM2-AS1 promoter. (e) ZFPM2-AS1 expression in SP1-overexpressed cells was assessed by RT-qPCR. **p < 0.01, ***p < 0.001
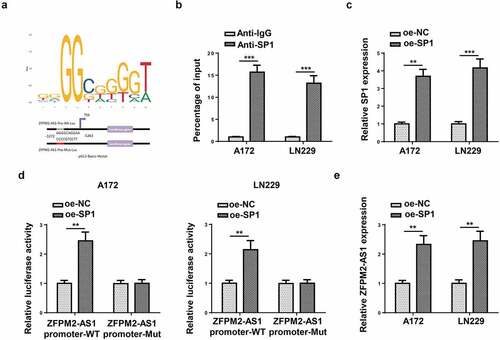
Figure 4. ZFPM2-AS1 interacted with miR-515-5p. (a) Potential miRNAs that had complementary base for ZFPM2-AS1 were obtained from starBase, and the interaction between ZFPM2-AS1 and these miRNAs was validated by RNA pull-down assay. (b) MiR-515-5p expression in glioma tissues and cells. (c) The transfection efficiency of miR-515-5p was confirmed by RT-qPCR. (d) Luciferase reporter assay was performed to verify the binding site between miR-515-5p and ZFPM2-AS1. (e) RIP assay was conducted to testify the interaction between miR-515-5p and ZFPM2-AS1. (f) Expression association between miR-515-5p and ZFPM2-AS1 was validated by Pearson’s association analysis. *p < 0.05, **p < 0.01, ***p < 0.001
Figure 5. SOD2 was the target gene of miR-515-5p. (a) Effect of miR-515-5p upregulation on the expression of the predicted targets. (b and c) RT-qPCR analysis of SOD2 expression in glioma tissues and cells. (d and e) The binding of SOD2 to miR-515-5p was proved by luciferase reporter and RIP assays. (f) Pearson’s association analysis was used to validate the expression correlation between SOD2 and miR-515-5p (or ZFPM2-AS1). *p < 0.05, **p < 0.01, ***p < 0.001
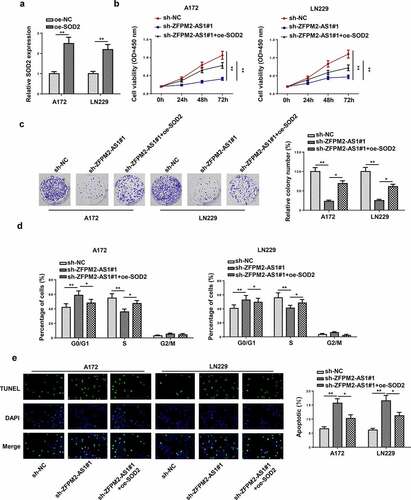
Figure 6. SOD2 participated in ZFPM2-AS1-mediated cell growth in glioma. (a) RT-qPCR analysis confirmed the upregulation of SOD2 in glioma cells transfected with SOD2 overexpression plasmid. (b and c) Cell proliferation in each group was evaluated by CCK-8 and colony formation assay. (d) Flow cytometry analysis was conducted to determine the cell cycle in each group. (e) The cell apoptosis was assessed via TUNEL assay. *p < 0.05, **p < 0.01