Figures & data
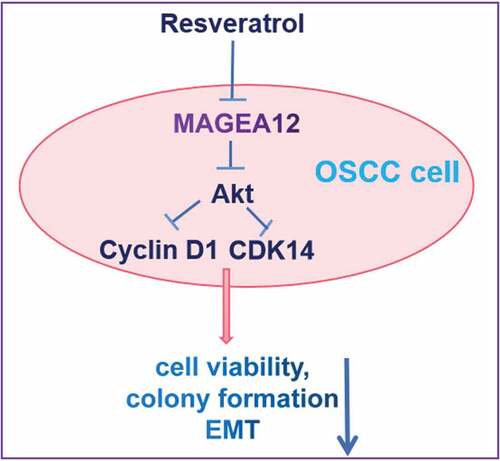
Figure 1. MAGEA12 overexpression induces proliferation and colony formation of OSCC cells. MAGEA12 plasmid was transfected into Cal-27 cells after 24 h, then protein and RNA were collected. Control cells were transfected with empty vector. (a) Western blot strips of MAGEA12 protein. (b) The relative expression levels of MAGEA12 protein by quantitation. (c) Quantitative RT-PCR of MAGEA12 mRNA. (d) Viability based on the CCK8 assay. (e) Colony formation based on analysis under an inverted microscope. The expression of Cyclin D1 and CDK14 was assessed by (f) western blot with (g) quantitation. Control cells were transfected with empty vector. *P < 0.05 vs control group (CON)
Figure 2. MAGEA12 promotes Akt signaling to induce growth of OSCC cells. MAGEA12 plasmid was transfected into Cal-27 cells for 24 h, and then cells were treated with Akt inhibitor MK-2206 (2 μM) for 12 h. Levels of Akt and p-Akt were (a) determined by western blot and (b) quantitated. Then assessed for (A) viability using the CCK8 assay and (B) colony formation. *P < 0.05 vs control group (CON). #P < 0.05 vs MAGEA12 overexpression group (MAGEA12)
Figure 3. Resveratrol suppressed cell proliferation and MAGEA12/Akt cascade in OSCC cells. (a) The relative cell viability was detected by CCK8 assay after treatment with resveratrol in different concentrations and time points. (b) The numbers of cell colonies were measured by microscope. (c-d) Western blot and quantitation. Compared with 0 μM of resveratrol group, *P < 0.05
Figure 4. Resveratrol inhibits MAGEA12 signaling to decrease the levels of p-Akt and the growth of OSCC cells. MAGEA12-overexpressing cells were treated with resveratrol, then levels of Akt and p-Akt were determined by (a) western blot and (b) quantitated. Next we assessed for (c) cell viability using the CCK8 assay and (d) colony formation. *P < 0.05 vs control group (CON). #P < 0.05 vs resveratrol group (RES)
Figure 5. Resveratrol inhibits Akt signaling to decrease the levels of cyclin and the growth of OSCC cells. Cells were treated with resveratrol or Akt agonist SC79 (2 μM) for 24 h, then levels of Cyclin D1 and CDK14 were determined by (a) western blot and (b) quantitated. Next we assessed for (c) cell viability using the CCK8 assay and (d) colony formation. *P < 0.05 vs control group (CON). #P < 0.05 vs resveratrol group (RES)