Figures & data
Table I. Cancer types evaluated from the TCGA dataset
Table II. Gene Set Enrichment Analysis for PPP1CB target genes
Table III. The expression levels of PPP1CB in clinical PAAD tissue are significantly higher compared with matched paracancerous tissue samples
Table IV. Relationship between PPP1CB expression and clinicopathological characteristics in PAAD patients
Figure 1. PPP1CB expression profiling in cancer tissue and normal tissue from The Cancer Genome Atlas. (a) PPP1CB expression across tumor datasets (T; red dots) and matched paracancerous tissue (N; green dots) datasets. Each single point represents the expression of PPP1CB in a single sample. Comparison between tumor and normal tissue was performed using the GEPIA tool, and significantly elevated expression was determined by a high log2FC value and a percentage value greater than the threshold value. Cancer types indicated in red have significantly higher PPP1CB expression than corresponding normal tissue. (b) Kaplan‑Meier survival analysis of patients based on PPP1CB expression (data from TCGA datasets). HR: hazard ratio. *P < 0.05.
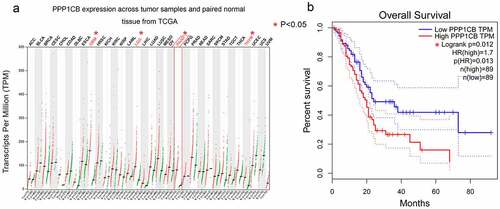
Figure 2. The Venn diagram produced by five databases to predict PPP1CB interacting partners and regulatory target genes. Each color represents the corresponding database
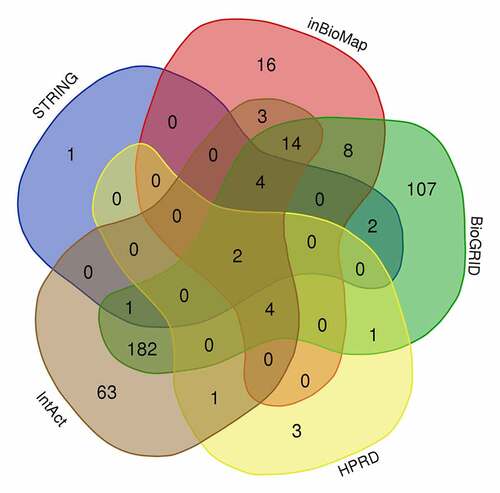
Figure 3. PPI network analysis of overlapping PPP1CB target genes. The PPI network contained 222 genes. Different nodes represent different genes and corresponding proteins connected in the PPI network. A variety of genes cooperate with each other to carry out biological functions. Red nodes indicate a node score of 13.64, blue nodes indicate a node score of 2.97, purple nodes indicate a node score of 2.875, orange nodes indicate a node score of 1.6, and green nodes indicate a node score of 1.273. Densely connected network components were identified via the MCODE algorithm, and the 39 genes with the highest score were selected as node genes (node score 13.64). PPI: protein protein interaction
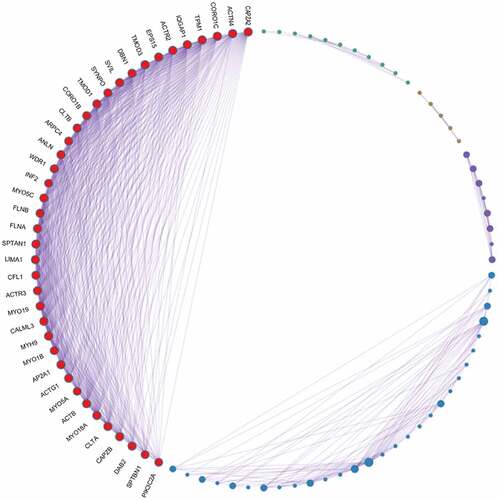
Figure 4. Evaluation of gene expression and prognostic significance of six nodal PPP1CB gene targets in PAAD. (a) Expression levels of six selected nodal genes were evaluated in PAAD and matched paracancerous tissues. The expression of 6 nodal genes in PAAD tissues (n = 179) was significantly higher compared with the matched paracancerous tissues (n = 171). Red and gray indicate PAAD and matched paracancerous tissues, respectively. (b) Prognostic value for the six nodal genes related to overall survival for patients with PAAD. Kaplan-Meier curves were generated using an online tool (data from the TCGA dataset). PAAD: pancreatic cancer. *P < 0.05.
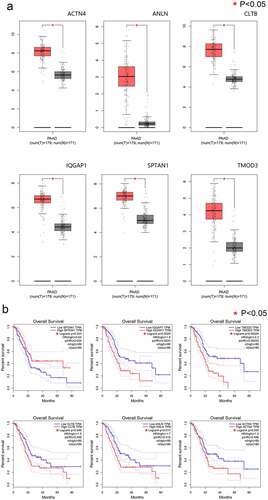
Figure 5. Effects of PPP1CB knockdown on invasion and migration of PAAD cell lines. (a) PPP1CB was knocked down in BXPC3, CAPAN-1, and PANC-1 cells using siRNA: si-NC (non-silencing control), si-PPP1CB-459, si-PPP1CB-911 and si-PPP1CB-1137. Knockdown efficiency was evaluated by Western Blot. (b) PPP1CB knockdown reduces PAAD cell migration. The wound healing assay was performed in BXPC3, CAPAN-1, and PANC-1 cell monolayers for 48 h, and the width of the gap for each group at 0 hours was used as the reference. (c) Invasion analyses of PAAD cells transfected with si-NC, or si-PPP1CB, relative to the invasion in the control group, reported as mean ± SD (n = 3). ***P < 0.001.
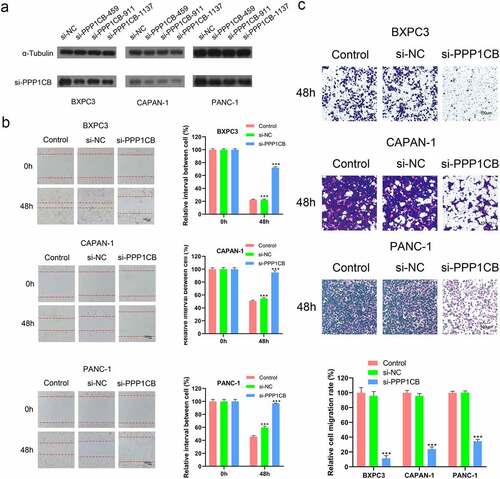
Figure 6. Photomicrographs of immunohistochemical staining for PPP1CB in PAAD clinical patient tissue samples. (a) Positive staining for PPP1CB. (b) Negative staining for PPP1CB. PPP1CB: protein phosphatase 1 catalytic subunit beta
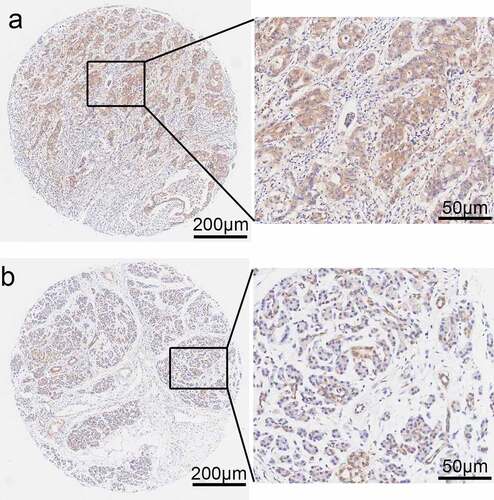
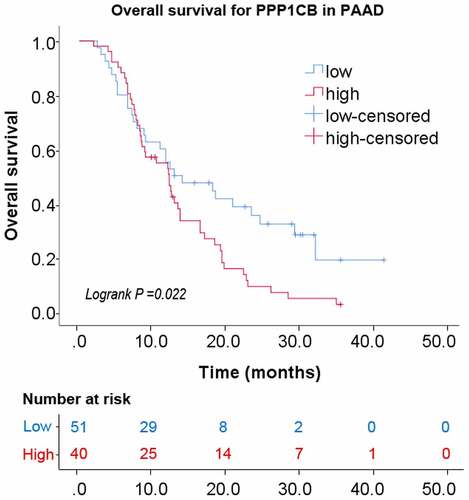
Figure 7. Kaplan-Meier analysis of PAAD. PPP1CB protein expression impact on overall survival. Immunohistochemical staining of PAAD tissue microarrays was used to determine the expression levels of PPP1CB. PPP1CB: protein phosphatase 1 catalytic subunit beta; PAAD: pancreatic adenocarcinoma