
Figures & data
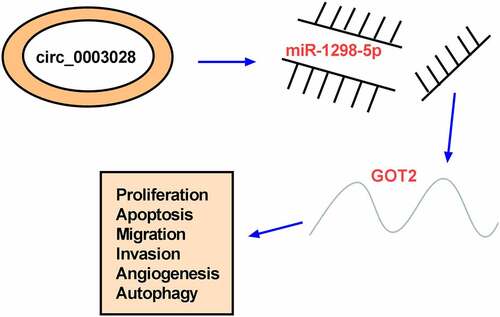
Figure 1. Circ_0003028 was elevated in NSCLC tissues and cells. (a) RT-qPCR assay was applied to determine the expression level of circ_0003028 in 53 pairs of NSCLC tissue samples and adjacent normal tissues. (b) Circ_0003028 level was detected in normal human bronchial epithelial cell line (BEAS-2B) and lung cancer cell lines (A-549, NCI-H1299, and NCI-H460) by RT-qPCR assay. (c) The cellular localization of circ_0003028 in A-549 and NCI-H1299 cells was analyzed by Subcellular fractionation assay. (d) The levels of circ_0003028 and linear FUT8 mRNA were assessed in A-549 and NCI-H1299 cells treated with or without RNase R by RT-qPCR assay. *P < 0.05
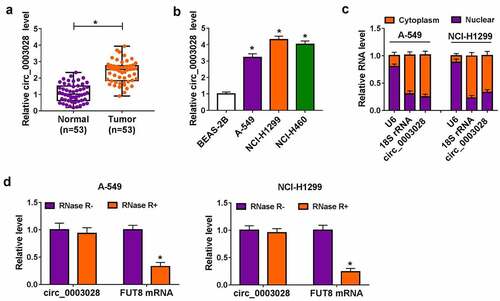
Figure 2. The effects of circ_0003028 silencing on proliferation, colony formation, cell cycle progression, apoptosis, migration, invasion, and autophagy in NSCLC cells. (a) Relative circ_0003028 level was determined by RT-qPCR assay in A-549 and NCI-H1299 cells transfected with si-NC, si-circ_0003028#1, si-circ_0003028#2, and si-circ_0003028#3. (b-j) A-549 and NCI-H1299 cells were transfected with si-NC, si-circ_0003028#2, and si-circ_0003028#3. (b) CCK-8 assay was used to assess cell proliferation in transfected A-549 and NCI-H1299 cells. (c) Cell colony formation assay was performed to examine the clone number in transfected A-549 and NCI-H1299 cells. (d) Flow cytometry assay was carried out to analyze cell cycle distribution in transfected A-549 and NCI-H1299 cells. (e) Flow cytometry assay was conducted to test apoptosis rate in transfected A-549 and NCI-H1299 cells. (f) Caspase 3 activity analysis was detected by the special kit. (g and h) Transwell assay was applied to determine migration and invasion in transfected A-549 and NCI-H1299 cells. (i) Tube formation assay was used to detect the tube formation ability of HUVEC in transfected A-549 and NCI-H1299 cells. (j) Western blot assay was implemented to determine the protein levels of Beclin1 and LC3-II/LC3I in transfected A-549 and NCI-H1299 cells.*P < 0.05
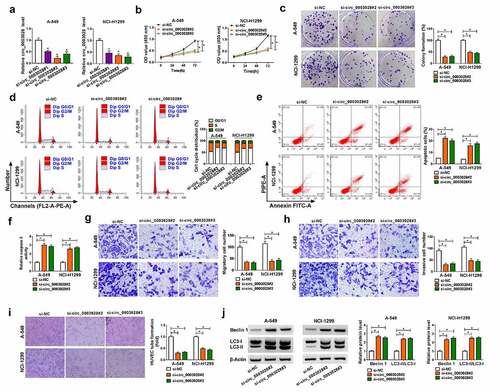
Figure 3. Circ_0003028 directly bound with miR-1298-5p. (a) Schematic of a putative target sequence for miR-1298-5p in circ_0003028 and mutated miR-1298-5p-binding sites. (b) A dual-luciferase reporter assay was utilized to verify the binding relationship in A-549 and NCI-H1299 cells. (c) miR-1298-5p endogenously associated with circ_0003028 was determined in A-549 and NCI-H1299 cell extracts by RIP assay. (d) Circ_0003028 level was detected in circ-NC or circ_0003028-transfected A-549 and NCI-H1299 cells by RT-qPCR assay. (e and f) miR-1298-5p level was measured by RT-qPCR assay in A-549 and NCI-H1299 cells transfected with circ-NC, circ_0003028, si-NC, and si-circ_0003028. (g) miR-1298-5p level was examined by RT-qPCR assay in NSCLC tissue samples and adjacent normal tissues. (h) The expression association between circ_0003028 and miR-1298-5p in NSCLC tumor tissues was assessed by Pearson correlation analysis. (i) miR-1298-5p level was determined in BEAS-2B, A-549, NCI-H1299, and NCI-H460 cells by RT-qPCR assay. *P < 0.05
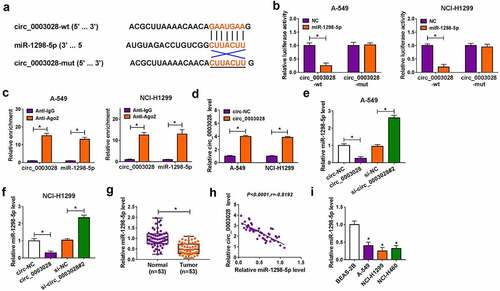
Figure 4. Downregulation of miR-1298-5p abolished the effects of circ_0003028 knockdown on proliferation, colony formation, cell cycle progression, apoptosis, migration, invasion, and autophagy in NSCLC cells. (a) miR-1298-5p level was detected in anti-NC or anti-miR-1298-5p-transfected A-549 and NCI-H1299 cells by RT-qPCR assay. (b-k) A-549 and NCI-H1299 cells were transfected with si-NC, si-circ_0003028#2, si-circ_0003028#2+ anti-NC, and si-circ_0003028#2+ anti-miR-1298-5p. (b) miR-1298-5p level was determined by RT-qPCR assay in transfected A-549 and NCI-H1299 cells. (c) Proliferation was assessed by CCK-8 assay in transfected A-549 and NCI-H1299 cells. (d) Colony number was calculated by colony formation assay in transfected A-549 and NCI-H1299 cells. (e and f) Cell cycle distribution and apoptosis rate were analyzed by flow cytometry assay in transfected A-549 and NCI-H1299 cells. (g) Caspase 3 activity was detected by special kit in transfected A-549 and NCI-H1299 cells. (h and i) Migration and invasion were measured by transwell assay in transfected A-549 and NCI-H1299 cells. (j) HUVEC tube formation ability was examined by tube formation assay in transfected A-549 and NCI-H1299 cells. (k) Protein levels of Beclin1 and LC3-II/LC3I were tested by western blot assay in transfected A-549 and NCI-H1299 cells. *P < 0.05
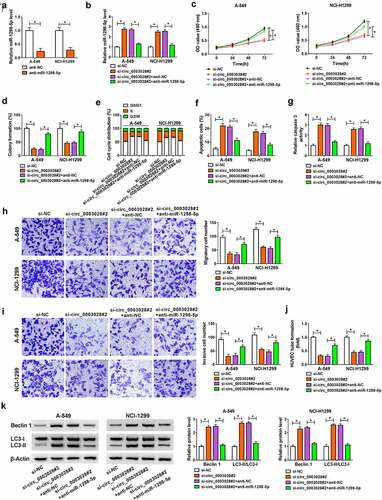
Figure 5. GOT2 was a direct target of miR-1298-5p. (a) The potential binding sites between GOT2 and miR-1298-5p were predicted using starbase software. (b) The binding relationship was proved by a dual-luciferase reporter assay. (c) RIP assay was performed to verify the interaction between GOT2 and miR-1298-5p. (d) GOT2 protein level was measured by western blot assay in A-549 and NCI-H1299 cells transfected with si-NC, si-circ_0003028#2, si-circ_0003028#2+ anti-NC, and si-circ_0003028#2+ anti-miR-1298-5p. (e and f) GOT2 expression was examined by RT-qPCR and western blot assay in NSCLC tissues. (g and h) Pearson correlation analysis was used to analyze the expression correlation of GOT2 with miR-1298-5p and circ_0003028 in NSCLC tissues. (i) GOT2 protein level was determined by western blot assay in BEAS-2B, A-549, NCI-H1299, and NCI-H460 cells. *P < 0.05
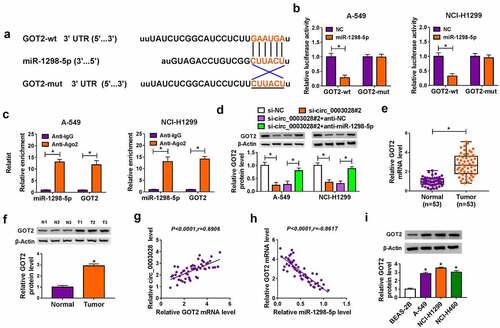
Figure 6. Overexpression of GOT2 abrogated miR-1298-5p-mediated NSCLC progression in vitro. (a) miR-1298-5p level was examined in NC or miR-1298-5p-transfected A-549 and NCI-H1299 cells by RT-qPCR assay. (b) GOT2 protein level was assessed in NC or miR-1298-5p-transfected A-549 and NCI-H1299 cells by western blot assay. (c-m) A-549 and NCI-H1299 cells were transfected with NC, miR-1298-5p, miR-1298-5p+vector, and miR-1298-5p+ GOT2. (c) GOT2 protein level was measured in transfected A-549 and NCI-H1299 cells by western blot assay. (d and e) The detection of cell proliferation was performed by CCK-8 assay. (f) The calculation of colony number was conducted by colony formation assay. (g and h) The analysis of cell cycle distribution and apoptosis rate was carried out by flow cytometry assay. (i) The determination of caspase 3 activity was executed by special kit. (j and k) The assessment of migration and invasion was implemented by transwell assay. (l) The tube formation of HUVEC cells was detected by tube formation assay in transfected A-549 and NCI-H1299 cells. (m) The detection of Beclin1 and LC3-II/LC3I protein levels was conducted by western blot assay in transfected A-549 and NCI-H1299 cells. *P < 0.05
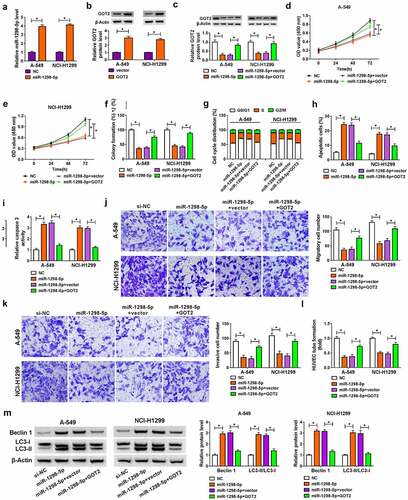
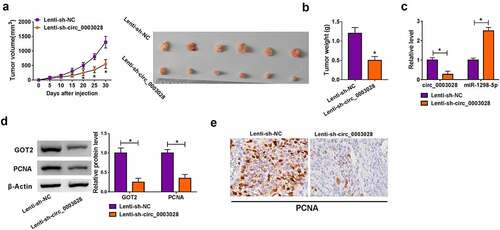
Figure 7. Circ_0003028 deficiency repressed NSCLC cell growth in vivo. A-549 cells introduced with Lenti-sh-NC or Lenti-sh-circ_0003028 were inoculated subcutaneously into the nude mice. (a and b) Tumor volume and tumor weight were detected in the xenografts. (c) Circ_0003028 and miR-1298-5p expression were examined by RT-qPCR assay in this xenograft. (d) Protein levels of GOT2 and PCNA were assessed by western blot assay in this xenograft. (e) The expression of PCNA was determined by Immunohistochemical staining of sections from the NSCLC xenograft model in nude mice. *P < 0.05
Data availability statement
All data generated or analysed during this study are included in this published article (and its supplementary information files).