Figures & data
Table 1. Primer sequences
Figure 1. MiR-155 was up-regulated in serum of patients with CIS. (a) Nano-magnetic beads under TEM. (b) MiR-155 expression was detected by Nano-PCR. *P < 0.05
Figure 2. Clinical significance of miR-155. (a) Prediction of CIS development via miR-155 according to ROC analysis, AUC: 0.783, 95% CI: 0.707–0.859. (b) MiR-155 before and after therapy, *P < 0.05. (c) MiR-155 in patients with recurrence and those without it, ***P < 0.001. (d) Prediction of CIS recurrence via miR-155 according to ROC analysis, AUC: 0.861, 95% CI: 0.758–0.965
Figure 3. Effects of miR-155 on spatial learning and memory in mice in the Morris water maze test. (a) Mean escape latency of reaching the submerged platform in the training period. (b) Quadrant residence time. (c) Number of platform-site crossover. 10 mice in each group. MiR-155 OE, miR-155 overexpression. **P < 0.01 vs. Control group
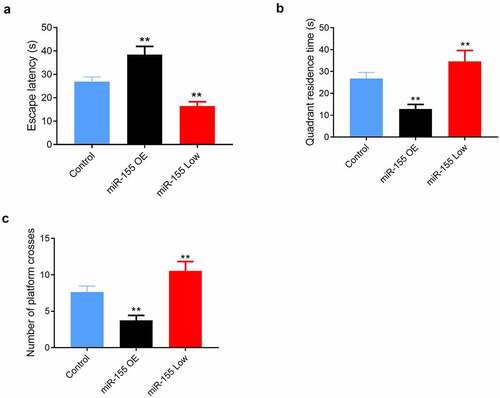
Figure 4. Effects of miR-155 on TLR4/MyD88 signaling pathway in mouse brain tissues. (a) The expression of miR-155 in brain tissues was detected by Nano-PCR. (b) The protein expression of TLR4 and MyD88 in brain tissues was measured by western blot. 10 mice in each group. MiR-155 OE, miR-155 overexpression. **P < 0.01 vs. Control group
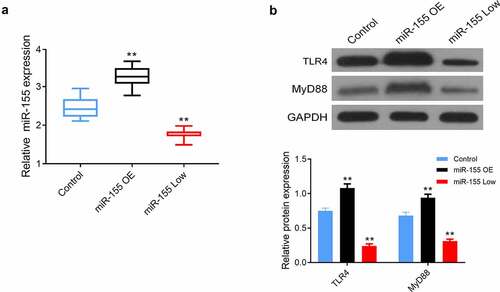
Figure 5. Effects of miR-155 on SH-SY5Y cell. (a) Cell proliferation was detected by CCK-8 assay. (b) Flow cytometry was used to measure cell apoptosis. (c) The protein expression of TLR4 and MyD88 in cells was evaluated by western blot. **P < 0.01 vs. miR-155-NC group
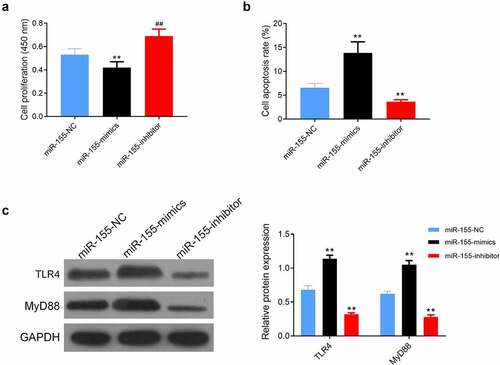
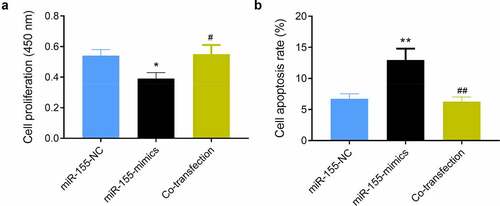
Figure 6. Impact of miR-155 on SH-SY5Y via TLR4/MyD88. (a) Cell proliferation was detected by CCK-8 assay. (b) Cell apoptosis was determined using flow cytometry. *P < 0.05 and **P < 0.01 vs. miR-155-NC group; #P < 0.05 and ##P < 0.01 vs. miR-155-mimics group. Co-transfection group, miR-155-mimics and TJ-M2010-2