Figures & data
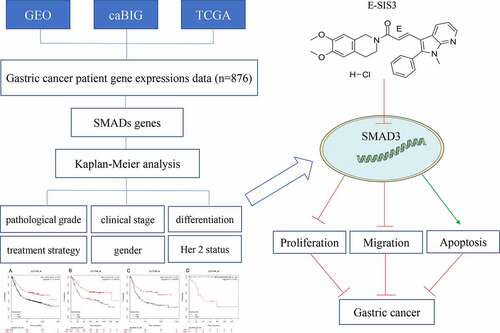
Figure 1. Prognostic value of SMAD1 expression in gastric cancer. Prognostic value of SMAD1 expression as shown by KM plotter (www.kmplot.com) curves. Affymetrix ID for SMAD1: 227798_ at. OS curves were plotted for A: all the patients (n = 876); B: intestinal cancer patients; C: diffuse cancer patients; D: mixed cancer patients
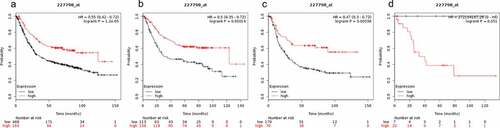
Figure 2. Prognostic value of SMAD2 expression in gastric cancer
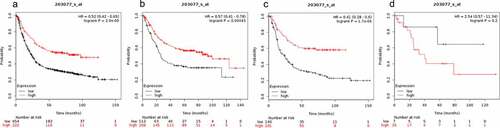
Figure 3. Prognostic value of SMAD3 expression in gastric cancer
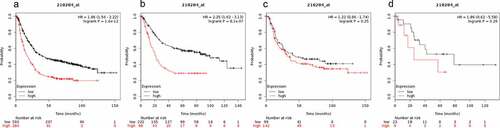
Figure 4. Prognostic value of SMAD4 expression in gastric cancer
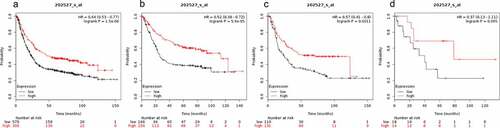
Figure 5. Prognostic value of SMAD5 expression in gastric cancer
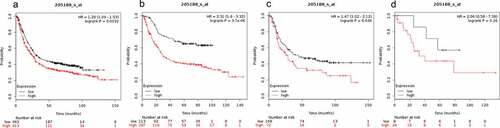
Figure 6. Prognostic value of SMAD6 expression in gastric cancer
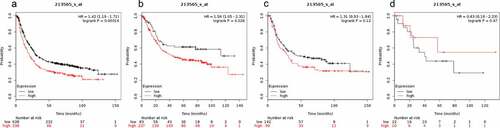
Figure 7. Prognostic value of SMAD7 expression in gastric cancer
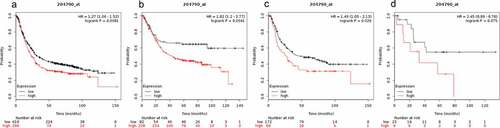
Figure 8. Prognostic value of SMAD9 expression in gastric cancer
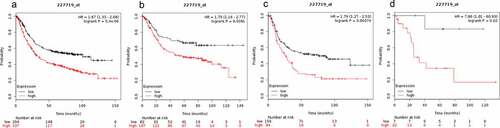
Table 1. Correlation of SMAD gene expression level with overall survival (OS) of gastric cancer patients in different pathological stages
Table 2. Correlation of SMAD gene expression level with overall survival (OS) of gastric cancer patients with different differentiation
Table 3. Correlation of SMAD gene expression level with overall survival (OS) of gastric cancer patients of different genders
Table 4. Correlation of SMAD gene expression level with overall survival (OS) of gastric cancer patients under different treatment strategies
Table 5. Correlation of SMAD gene expression level with overall survival (OS) of gastric cancer patients under different Her2 status
Figure 9. (e)-SIS3 inhibits proliferation of gastric cancer cells
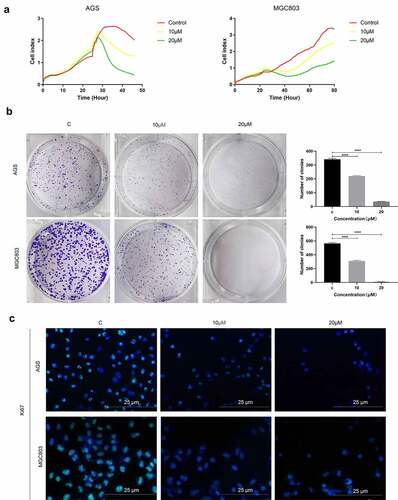
Figure 10. (e)-SIS3 inhibits the migration of gastric cancer cells
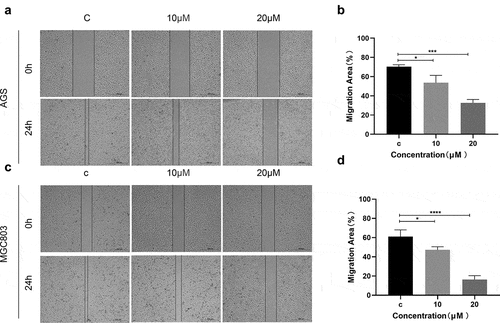
Figure 11. (e)-SIS3 induces apoptosis of gastric cancer cells
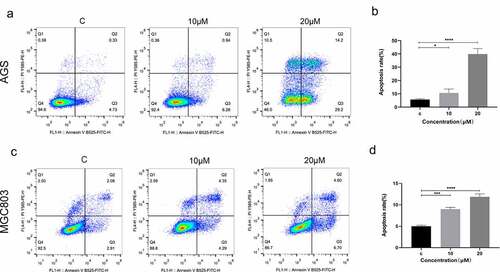
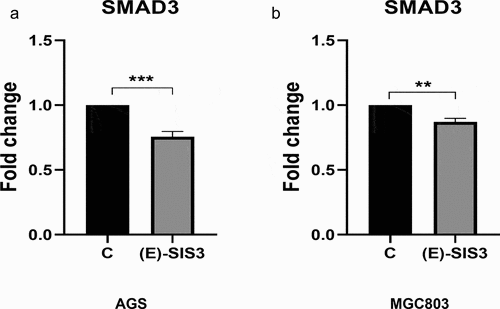
Figure 12. (e)-SIS3 inhibits proliferation and induces apoptosis of gastric cancer cells through influencing SMAD3 gene expression