
Figures & data
Figure 1. ELK1 induced LINC01638 in papillary thyroid carcinoma cell lines. A, The expression of LINC01638 in PTC cell lines TPC-1, IHH-4, BCPAP and thyroid gland epithelial cell line Nthy-ori3-1 was detected by qRT-PCR. B, The expression of LINC01638 in PTC cell lines and Nthy-ori3-1 was detected by qRT-PCR. Data are expressed as mean ± SD. **P < 0.01, ***P < 0.001 versus Nthy-ori3-1 cell line. C, The luciferase reporter assay was used to determine the binding relationship between ELK1 and LINC01638. Data are expressed as mean ± SD. ***P < 0.001 versus MIIP (full)-L+ OV-NC; ##P < 0.01, ###P < 0.001 versus MIIP (full)-L+ OV-ELK1. D, The protein expression of ELK1 was detected by western blot after transfection of pcDNA-ELK1. E, The expression of LINC01638 was detected by qRT-PCR after transfection of pcDNA-ELK1. Data are expressed as mean ± SD. *P < 0.05, ***P < 0.001 versus pcDNA-NC. F, The protein expression of ELK1 was detected by western blot after transfection of shRNA-ELK1. G, The expression of LINC01638 was detected by qRT-PCR after transfection of shRNA-ELK1. Data are expressed as mean ± SD. **P < 0.01, ***P < 0.001 versus shRNA-NC
Figure 2. The effects of LINC01638 silencing on cell proliferation of PTC cells. A, The mRNA expression levels of LINC01638 were measured by qRT-PCR. B, CCK-8 was used to assess the cell proliferative capacity after transfection of shRNA-LINC01638. C, Colony formation assay was carried out to detect the cell colony ability. D, The level of Ki67 in TPC-1 cells was evaluated by immunofluorescence assay. Data are expressed as mean ± SD. *P < 0.05, **P < 0.01, ***P < 0.001 versus control; #P < 0.05, ##P < 0.01, ###P < 0.001 versus shRNA-NC group
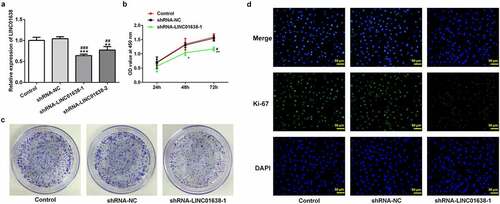
Figure 3. LINC01638 silencing suppresses PTC cell migration, invasion and cell cycle progression. A, Wound healing assay was performed to determine the migration of TPC-1 cells. B, Cell invasion of TPC-1 cells transfected with shRNA-LINC01638 was investigated by transwell assay. C, The effects of LINC01638 silencing on MMP2 and MMP9 were measured by western blot analysis. D and E, The cell cycle stage distribution was estimated by flow cytometric analysis. Data are expressed as mean ± SD. ***P < 0.001 versus control; ###P < 0.001 versus shRNA-NC group
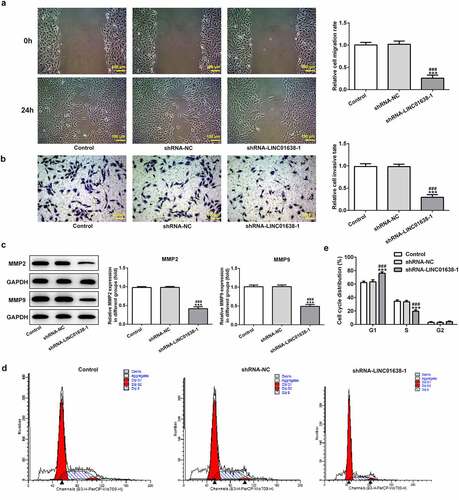
Figure 4. The effects of LINC01638 silencing on Wnt/β-catenin signaling pathway in TPC-1 cells. The protein level of c-MYC (a), Axin2, β-catenin and CyclinD1 (b) in TPC-1 cells with transfection of shRNA-LINC01638-1 was assessed by western blot assay. Data are expressed as mean ± SD. **P < 0.01, ***P < 0.001 versus control; ##P < 0.01, ###P < 0.001 versus shRNA-NC group
Figure 5. Overexpressed LINC01638 in TPC-1 cells regulates Wnt/β-catenin signaling. A, The expression of LINC01638 was measured by qRT-PCR after transfection with pcDNA-LINC01638. B, The protein expressions of c-MYC, Axin2, β-catenin and CyclinD1 were monitored by western blot analysis. Data are expressed as mean ± SD. **P < 0.01, ***P < 0.001 versus control; ##P < 0.01, ###P < 0.001 versus shRNA-NC group
Figure 6. LINC01638 overexpression regulates TPC-1 cell proliferation, migration, invasion and cell cycle via Axin2. The mRNA (a) and protein expression (b) of Axin2 in TPC-1 cells transfection with Axin2-overexpressed vectors were detected by qRT-PCR and western blot assay, respectively. Cell proliferation was estimated by CCK-8 assay (c) and colony formation assay (d) after transfection with pcDNA-LINC01638 in the presence and absence of Axin2 OV. E, Immunofluorescence assay was employed to evaluate the level of Ki67 in TPC-1 cells. Data are expressed as mean ± SD. ***P < 0.001 versus control; #P < 0.05, ##P < 0.01, ###P < 0.001 versus respective NC groups. ΔΔP < 0.01 versus pcDNA-LINC01638+ NC
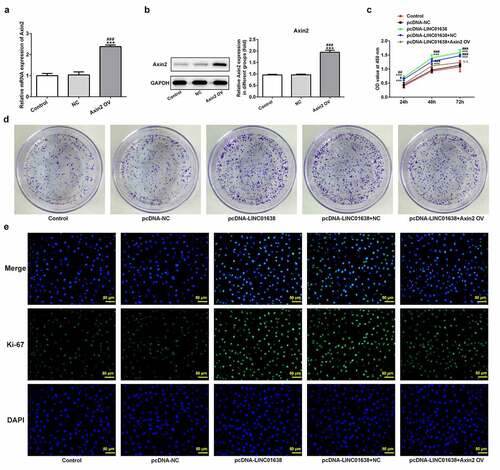
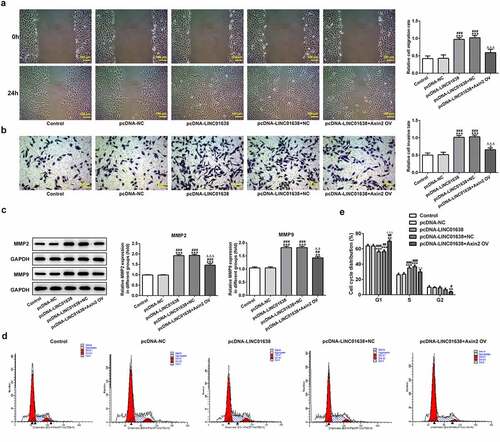
Figure 7. Axin2 reverses the effects of LINC01638 overexpression on PTC cell migration, invasion and cell cycle progression. A, Cell migration of TPC-1 cells was investigated by wound healing assay. B, Transwell assay was performed to determine TPC-1 cell invasion after transfection with pcDNA-LINC01638. C, The levels of MMP2 and MMP9 in TPC-1 cells transfection with pcDNA-LINC01638 in the presence and absence of Axin2 OV were measured by western blot analysis. D and E, Flow cytometric analysis was implemented to evaluate the cell cycle stage distribution. Data are expressed as mean ± SD. *P < 0.05, **P < 0.01, ***P < 0.001 versus control; #P < 0.05, ##P < 0.01, ###P < 0.001 versus pcDNA-NC group. ΔΔP < 0.01, ΔΔΔP < 0.001 versus pcDNA-LINC01638+ NC
Availability of data and materials
All data generated or analyzed during this study are included in this published article.