Figures & data
Figure 1. Normalization of three datasets and expression of miR-223-3pin three septic miRNA-seq experiments. a and b represent the normalization and miR-223-3p expression in three septic miRNA-seq experiments: GSE94717, GSE101639, and GSE149764, respectively
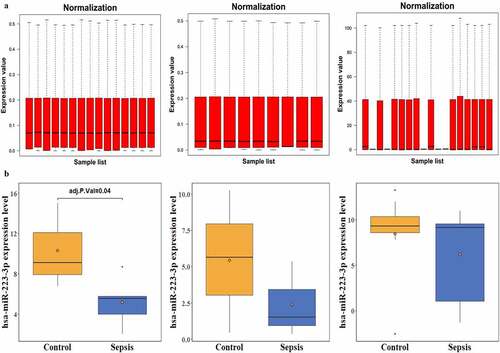
Figure 2. Heatmap of differentially expressed genes (DEGs). The top 20 upregulated and downregulated genes, examined in GSE100159, are visualized in the heatmap plot. The X-axis indicates samples, while the Y-axis represents genes. Gene expression is ranked from dark blue (low expression) to red (high expression) color. Samples are divided into two groups: patients with sepsis (pink) and healthy controls (light blue)
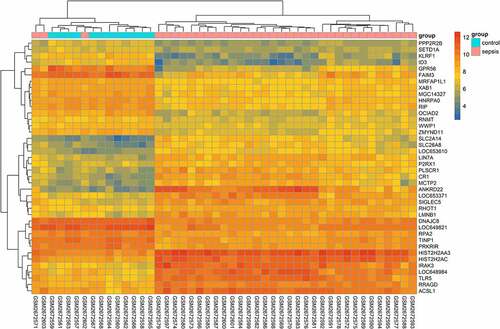
Figure 3. Functional analysis of miR-223-3p targeted genes. A represents the overlapping genes between upregulated septic genes in GSE100159 and miR-223-3p targets. B and C depict the gene ontology (GO) functional analysis of overlapping genes in the circle and bar plots
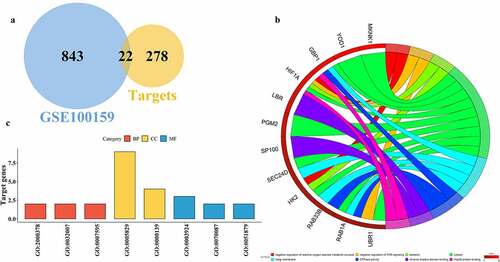
Table 1. Overlapping septic gene expression. The table lists the expression information of 22 upregulated target genes in GSE100159 that are associated with sepsis
Table 2. The Kyoto Encyclopedia of Genes and Genomes (KEGG) pathways of targeted genes. The table shows the KEGG functional analysis of miR-233-3p target genes constructed using the database for annotation, visualization and integrated discovery (DAVID)
Figure 4. Protein–protein interactions (PPIs) of miR-223-3p targets. The PPIs of miR-223-3p targeted genes are analyzed and depicted using STRING
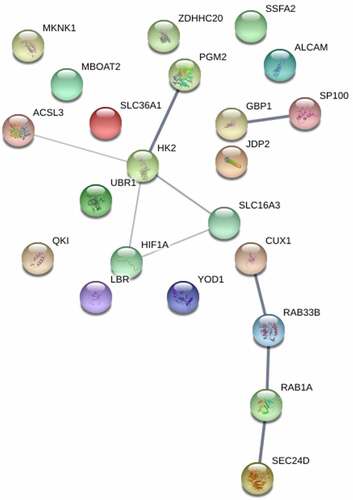
Figure 5. Heatmap of differentially expressed genes (DEGs) in GSE13904. The heatmap shows the expression of the top 20 upregulated and downregulated genes. The X-axis and Y-axis indicate samples and genes, respectively. The color gradation represents the expression of genes – from dark blue (low expression) to red (high expression). The two groups are annotated using two colors: pink for patients with sepsis and light blue for healthy controls. To clarify the heatmap, gene expression has been transformed using the log2 (1+ expression) method
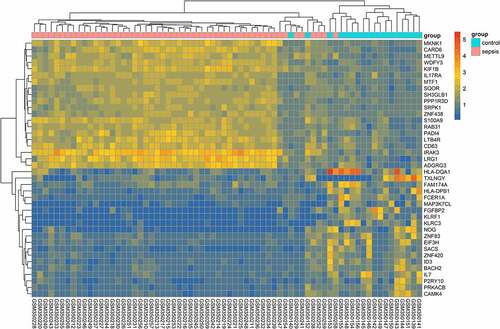
Figure 6. Crucial target genes expression level and receiver operating characteristic (ROC) curve. A depict the gene expression of hypoxia-inducible factor 1-alpha (HIF1A), MAP kinase-interacting serine/threonine-protein kinase 1 (MKNK1), and hexokinase 2 (HK2); B plots the expression of MKNK1 before and after early therapy treatment; C represent the area under the curve (AUC) of the ROC curve for HIF1A, MKNK1, and HK2 to divide subjects into patients with sepsis and healthy controls; D depicts the discriminability of responders and nonresponders of patients with sepsis
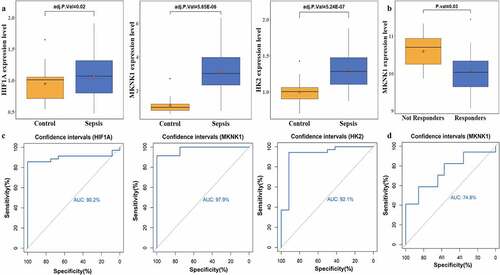
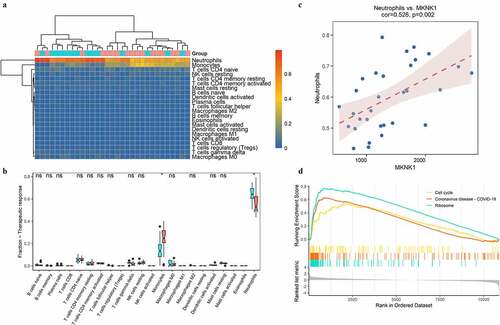
Figure 7. Distributions of immune cells with sepsis. A indicated the correlation map of 22 immune cells; B represented the correlation of three targeted genes and immune cells with different distribution between sepsis and healthy people. C and D showed the heatmap and boxplots of immune cells in people with sepsis (red) and healthy controls (blue)
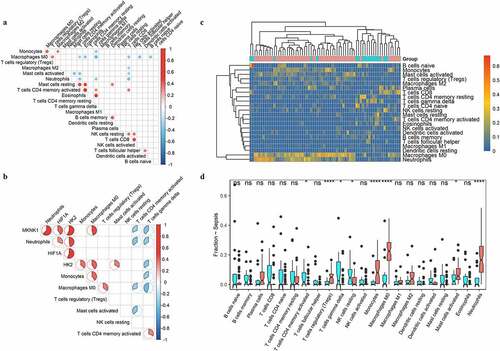
Figure 8. Immunity analysis in sepsis under therapy. The distributions of immune cells among septic samples with (red) or without (blue) response to therapy were depicted with heatmap (a) and boxplots (b). The correlation of MKNK1 expression and fraction of neutrophils was visualized with scatter plot (c); top 3 enriched pathways obtained from GSEA were showed in D