Figures & data
Figure 1. Flow chart of study design and analysis
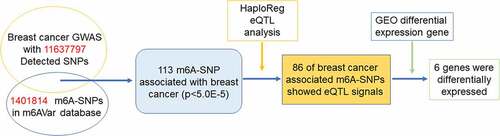
Figure 2. Manhattan plot of identified m6A-SNPs associated with breast cancer. The Manhattan plot showed – log10(p.value) for each of 17,599 m6A-SNPs associated with breast cancer. There were 285 m6A-SNPs associated with breast cancer (p < 0.001), and 113 m6A-SNPs associated with breast cancer (p < 5.0E-5)
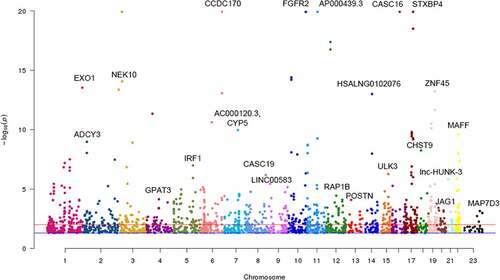
Figure 3. GO enrichment analysis was performed to annotate the potential function of genes corresponding to identified m6A-SNPs
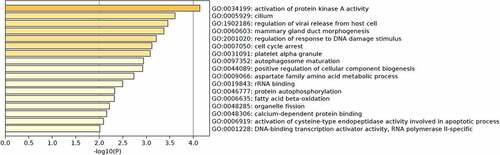
Table 1. Six genes of eight m6A-SNPs associated with breast cancer were differentially expressed between controls and breast cancer in the GSE15852
Figure 4. Expression levels of selected genes in GSE15852 dataset. TOM1L1 and ESR1 were highly expressed, but MAFF, TNS1, EFEMP2, and TRIM31 were significantly downregulated in breast cancer
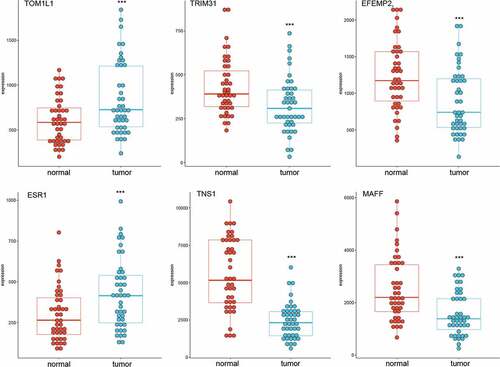
Figure 5. Expression levels of selected genes in GSE115144 and GSE109169 dataset, and we found only TNS1 was differentially expressed in GSE115144 (a) and GSE109169 (b) datasets
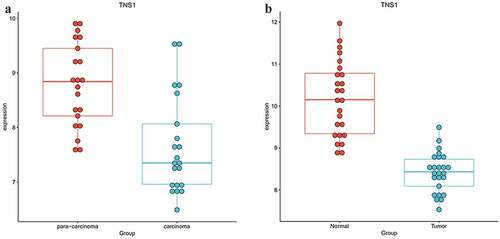
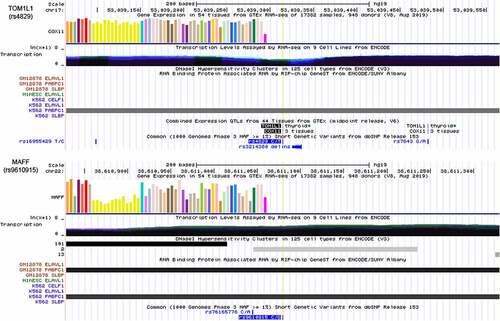
Figure 6. The genomic sequence of TOM1L1 and MAFF transcripts were used to predict the m6A modification on website (http://www.cuilab.cn/sramp). There were moderately-highly convincible m6A-modified predicted peaks near TOM1L1 (rs4829) and a moderately convincible m6A-modified predicted peak near MAFF (rs9610915)
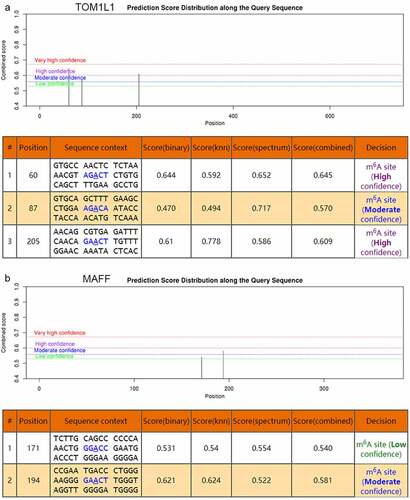
Figure 7. Integrative analysis of the potential function of rs4829 and rs9610915 SNPs by querying USCS. The SNP rs4829 was located on the 3’UTR of the TOM1L1 gene on chromosome 17 and rs9610915 was located on the 3’UTR of the MAFF gene on chromosome 22. Further, RIP-chip GeneST from ENCODE/SUNY Albany data suggested that polyadenylate-binding protein cytoplasmic 1 (PABPC1) might have a potential interaction with rs4829 (TOM1L1) and rs9610915 (MAFF)