Figures & data
Figure 1. KAT2B expression in primary tumors and cell lines
(a-i) Photographs of immunohistochemistry. (a-ii) Pie charts of the immunohistochemical intensity scores of KAT2B. (b) KAT2B expression in cervical cancer from GEPIA database. (c) KAT2B mRNA expression level in 52 samples of cervical cancer tissues and paired adjacent nontumor tissues was determined by qPCR. (d) KAT2B mRNA expression level was determined by qPCR in the cervical cancer cell lines and the normal cervical squamous epithelial cell line H8. (e-i) KAT2B expression was determined in a normal cervical squamous epithelial cell line and cervical cancer cell lines by western blot analysis. (e-ii) Western blot analysis of KAT2B. *p < 0.05, **p < 0.01, ***p < 0.001.
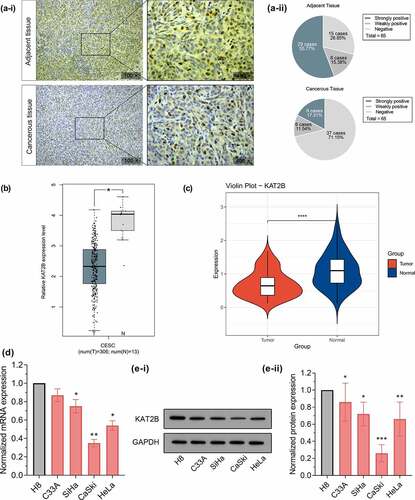
Table 1. Clinical characteristics of patients with cervical cancer according to KAT2B expression
Figure 2. Kaplan-Meier analysis of overall survival and disease-free survival
(a &b) Overall survival and disease recurrence-free survival analysis plots of KAT2B.
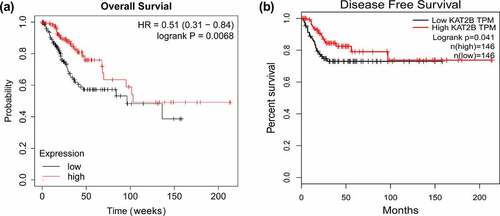
Figure 3. KAT2B inhibited the progression of cervical cancer in vitro.
(a) The transfection efficacy was determined by qPCR. (b) Cell proliferation was measured by CCK-8. (c-i) KAT2B knockdown promoted C33A migration and invasion, KAT2B overexpression inhibited CaSki migration and invasion. (c-ii) Statistics analysis of the mean migration and invasion cell numbers as compared with the negative control (n = 3). *p < 0.05, **p < 0.01, ***p < 0.001.
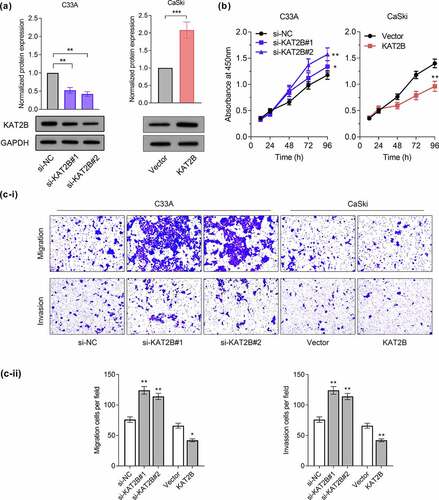
Figure 4. Effects of KAT2B on EMT in cervical cancer cells
(a) Performance of GSEA based on GEO datasets. (b-i) Western blot assay was applied to examine EMT markers’ expression. (b-ii) Statistical analysis of western blot results. *p < 0.05, **p < 0.01, ***p < 0.001.
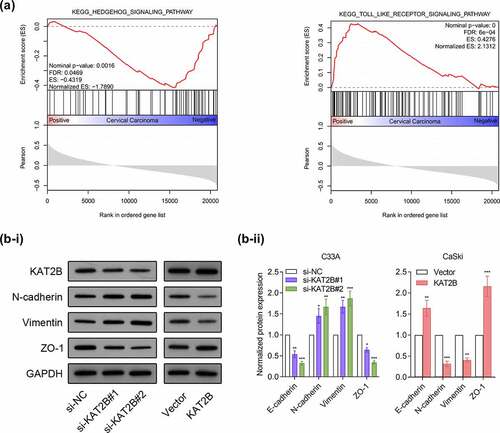
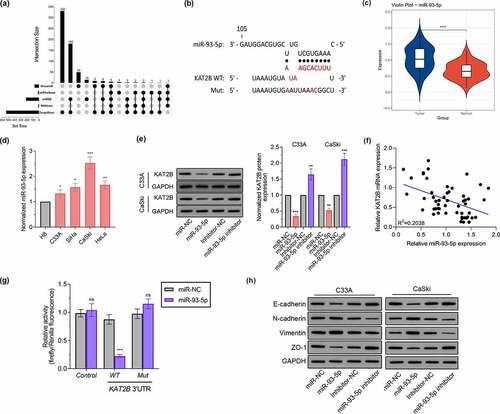
Figure 5. KAT2B expression was negatively regulated by miR-93-5p
(a) UpSet plot of miRNAs differentially expressed using five independent databases. (b) Bioinformatics database prediction of the binding site of miR-93-5p on the KAT2B 3'-UTR. (c) Relative miR-93-5p expression level was determined by qPCR in paired normal and cervical cancer tissues. (d) The expression of miR-93-5p in one normal cervical squamous epithelial cell and four cervical cancer cell lines by qPCR analyses. (e) Western blot analysis of KAT2B protein in cervical cancer cells transfected with miR-93-5p mimics or inhibitor. (f) The correlation between miR-93-5p gene expression and KAT2B expression. (g) Dual-luciferase reporter assay indicated that miR-93-5p binds to KAT2B mRNA 3'UTR directly. (h) Expression levels of EMT-associated markers in cervical cancer cell lines following transfection with miR-93-5p mimics or inhibitor were evaluated by western blot analysis. *p < 0.05, **p < 0.01, ***p < 0.001.