Figures & data
Table 1. The detailed information of the two datasets
Figure 1. Volcano plot distribution and heatmap of the DEGs. (a) Volcano plot of GSE33455 and GSE36135. The red points indicate upregulated DEGs, the blue points indicate downregulated DEGs, and the gray points indicate DEGs with no significant difference in expression; (b) DEG heatmap of GSE33455 and GSE36135. From red to green, the expression level of the genes in the samples gradually decreases. All DEGs are screened based on adj. P value < 0.05, |log2 FC | > 1. (DEGs, differentially expressed genes; S, docetaxel-sensitive; R, docetaxel-resistant)
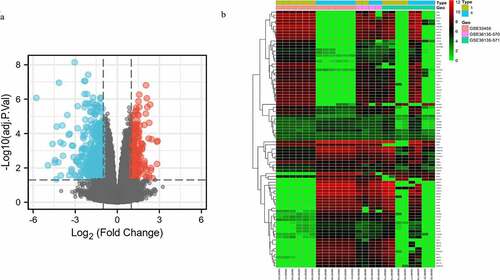
Figure 2. Functional enrichment analysis of DEGs
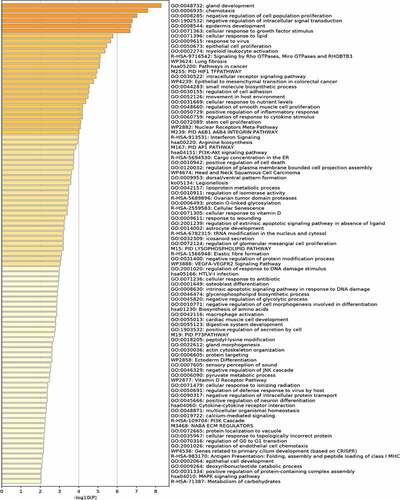
Figure 3. (a) Protein-Protein Interaction (PPI) network of differentially expressed genes (DEGs); (b) hub gene network construction using ‘cytoHubba.’
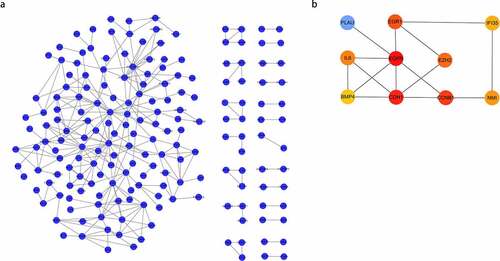
Figure 4. (a) Gene expression of the 10 hub genes between tumor and normal tissues; (b) Disease-free survival (DFS) analysis of the hub genes (P < 0.05)
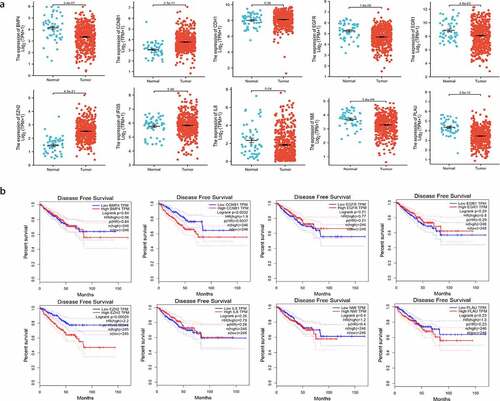
Figure 5. Immunohistochemical analyses confirmed the differential expression of (a) CCNB1 and (b) EZH2.
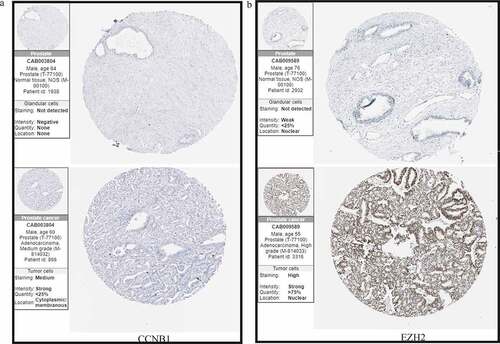
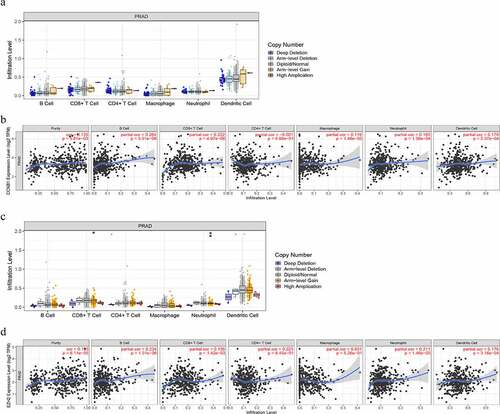
Figure 6. The relationship between immune cell infiltration and altered gene copy numbers of (a) CCNB1 and (c) EZH2; the association between immune cell infiltration level and gene expression of (b) CCNB1 and (d) EZH2 (P < 0.05)