Figures & data
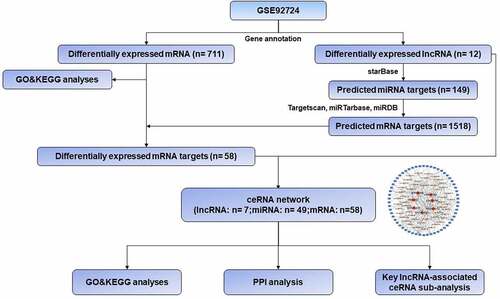
Table 1. The differentially expressed lncRNAs in GSE92724
Figure 1. Workflow of the present study
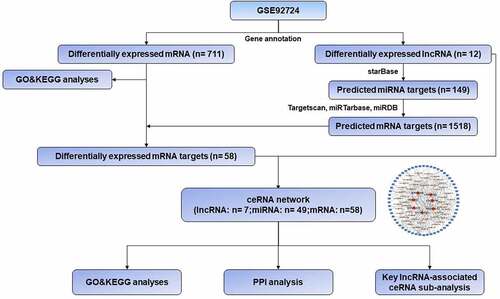
Figure 2. Differentially expressed mRNAs and lnRNAs in GSE92724. (a) the volcano plot of the differentially expressed mRNAs. (b) the volcano plot of the differentially expressed lncRNAs. (c) the heatmap of the differentially expressed mRNAs. (d) the heatmap of the differentially expressed lncRNAs. the red dots indicated up-regulated genes and the blue dots indicated down-regulated ones. the gray dots indicated genes which are not differentially expressed
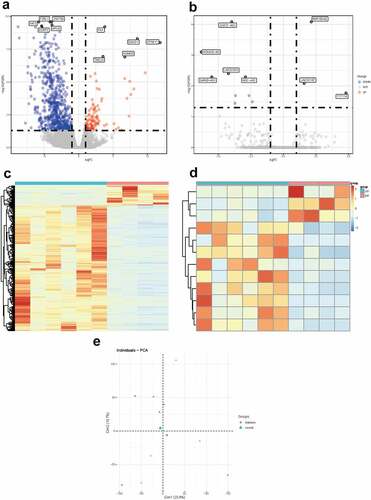
Figure 3. Functional enrichment analysis of DEmRNA. (a) GO enrichment analysis. (b) KEGG pathway analysis
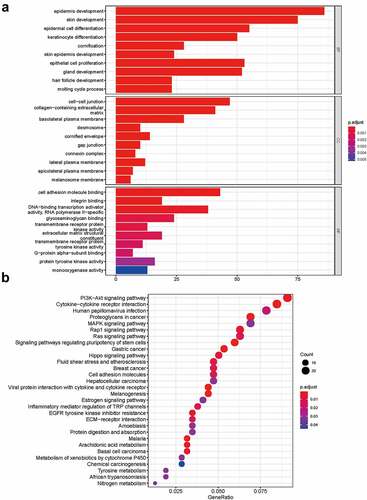
Table 2. Subcellular localization of DElncRNAs predicted in the lncLocator database
Figure 4. Construction of ceRNA network. Red diamonds indicated lncRNAs, yellow triangles indicated miRNAs and blue rectangles indicated mRNAs. Gray edges indicated the lncRNA-miRNA-mRNA interactions
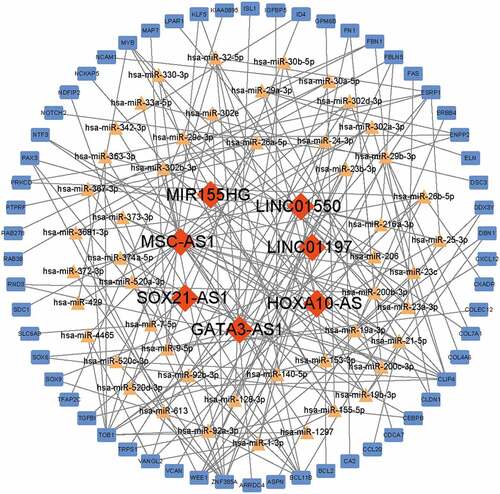
Figure 5. Functional enrichment analysis of the ceRNA network. (a) GO enrichment analysis. (b) KEGG pathway analysis. (c) PPI analysis. Edges indicated the protein-protein interactions
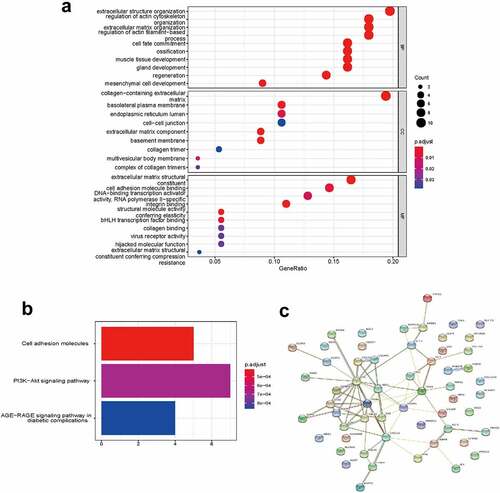
Table 3. The differentially expressed genes in ceRNA (node degree ≥ 6)
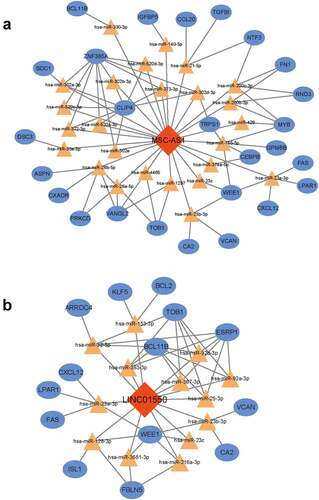
Figure 6. Conduction of key ceRNA sub-network. (a) MSC-AS1-associated ceRNA sub-network. (b) the LINC01550-associated ceRNA sub-network. Red diamonds indicated lncRNAs, yellow triangles indicated miRNAs and blue rectangles indicated mRNAs. Gray edges indicated the lncRNA-miRNA-mRNA interactions