
Figures & data
Figure 1. The prediction of pivotal miRNAs in VSMCs which participated in the pathogenesis of AS
(a-c) GSE127016 and GSE2655 were reanalyzed, the results of which suggested that multiple miRNAs, including miR-146b-3p, probably participated in the pathogenesis of AS. Volcano map displayed all detected miRNAs. MiRNAs with significant alterations of expressions (P < 0.05) and log2FC<-1 were marked in blue, and miRNAs with significant alterations of expressions (P < 0.05) and log2FC>1 were marked in red. Heat map displayed the 6 miRNAs (miR-146b-3p, miR-142-5p, miR-15b-3p, miR-708, miR-342-3p, and miR-488) with differential expression in both datasets.
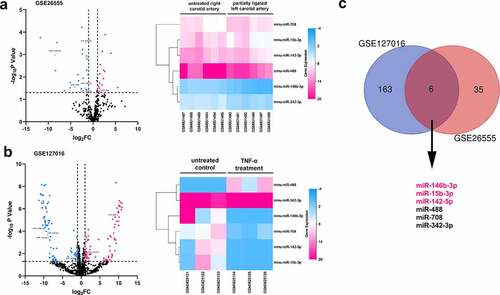
Figure 2. The effect of PDGF treatment on the expression of miR-146b-3p in VSMCs
(a) The expression of miR-146b-3p was quantified employing qRT-PCR after VSMCs were treated with different concentrations of PDGF for 24 h. (b) The expression of miR-146b-3p was detected by qRT-PCR after VSMCs were treated with 40 ng/ml PDGF for different times.*, **, and *** denote P < 0.05, P < 0.01, and P < 0.001 in comparison with 0 ng/ml group or 0 h group, respectively.
Figure 3. The effect of miR-146b-3p on VSMCs
(a) The transfection efficiency of miR-146b-3p mimics was detected by qRT-PCR. (b) The proliferation of VSMCs was detected by BrdU assay. (c) The cell cycle distribution of VSMCs was analyzed by flow cytometry analysis. (d) The migration of VSMCs was detected by Transwell experiment. Scale bar = 50 μm.(e) Western blot was employed for detecting the expression of VSMC differentiation markers α-SMA, SM22α, SMMHC, and Calponin.*** denotes P < 0.001. In c, *** represents P < 0.001 in comparison with control (CTL) group. && and &&& represent P < 0.01 and P < 0.001 in comparison with mimics control (mimic_CTL) group.
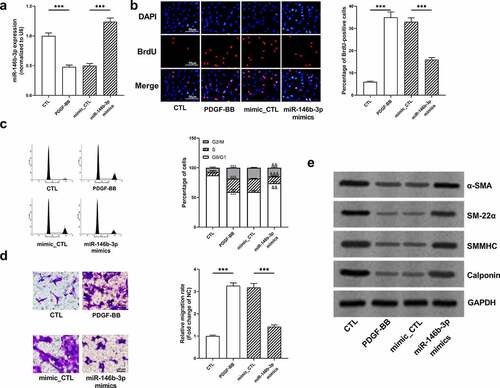
Figure 4. The prediction of pivotal genes in VSMCs which participated in the pathogenesis of AS
(a-b) GSE38574 and GSE28829 were reanalyzed, the results of which suggested that multiple genes, including PIK3CG, probably participated in the pathogenesis of AS. Volcano map indicated all detected genes. Genes with significant alterations of expression (P < 0.05) and log2FC<-1 were marked in blue, while genes with significant alterations of expression (P < 0.05) and log2FC>1 were marked in red. Heat map displayed 30 genes with significant alterations (P < 0.05) and log2FC>1 in both GSE38574 and GSE28829. (c) PIK3CG was differentially expressed in both GSE38574 and GSE28829, and it was predicted as a target gene of miR-146b-3p by TargetScan database.
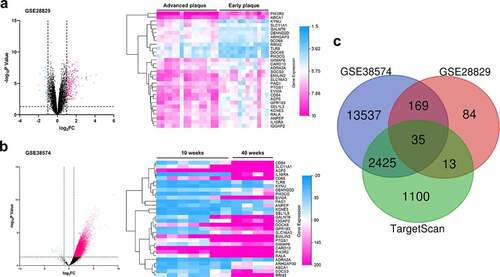
Figure 5. The expression of PIK3CG was inhibited by miR-146b-3p in VSMCs
(a) The binding sequence between miR-146b-3p and PIK3CG was predicted by TargetScan database. (b) The binding site between miR-146b-3p and PIK3CG was verified by dual-luciferase gene experiment. (c) The expression of PIK3CG mRNA in VSMCs was detected by qRT-PCR after the transfection of miR-146b-3p mimics. (d) The expression of PIK3CG protein in VSMCs was quantified employing Western blot after the transfection of miR-146b-3p mimics. mimic_CTL represents mimic control; *** denotes P < 0.001.
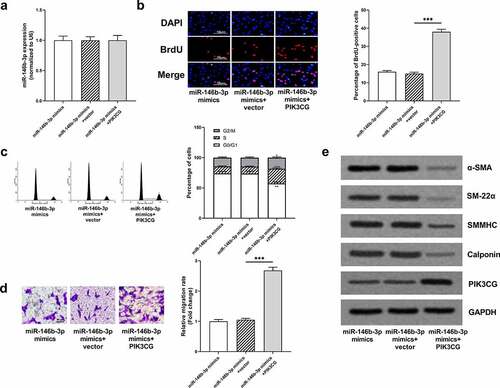
Figure 6. The effects of miR-146b-3p on VSMCs were abrogated by PIK3CG
(a) The expression of miR-146b-3p was detected employing qRT-PCR after co-transfection. (b) The proliferation of VSMCs was assessed by BrdU assay. (c) Cell cycle distribution of VSMCs was analyzed employing flow cytometry. (d) Transwell assay was employed for detecting the migration of VSMCs. Scale bar = 50 μm. (e) Western blot was implemented for detecting expressions of α-SMA, SM22α, SMMHC, Calponin, and PIK3CG.*** denotes P < 0.001.Vector represents empty vector (pcDNA); PIK3CG represents PIK3CG overexpression plasmids (pcDNA-PIK3CG); *, **, and *** represent P < 0.05, P < 0.01, and P < 0.001, respectively, compared with miR-146b-3p mimics+vector group.
Supplemental material