Figures & data
Figure 1. Clustering dendrogram of GSE109048. (a) A clustering tree of samples was constructed with expression; cutoff for outgroups was depicted with a red line. (b) The associated clinical traits were mapped to the clustering tree without outgroups
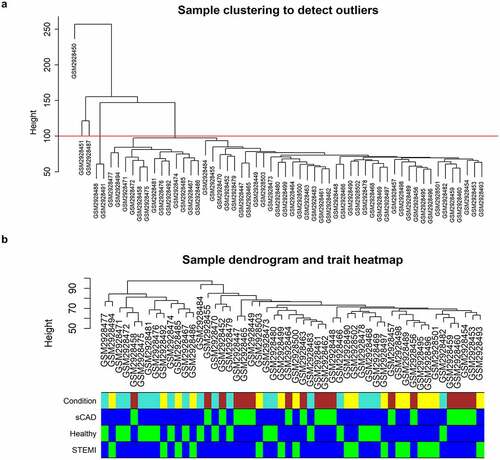
Figure 2. Immune cell distribution among the three groups. (a) Heatmap was constructed to depict the distribution of immune cells among samples. (b) Comparison of immune cells in the three groups was visualized with violin plots. (c) The capability of immune cells in identifying patients with STEMI was shown using ROC plots
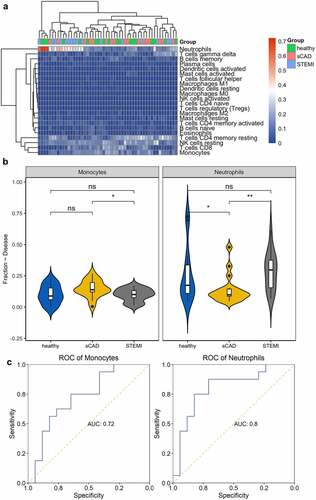
Figure 3. ROC and correlation analysis of DEGs. (a) ROC analysis of DEGs in identifying patients with STEMI. The potential of DEGs in separating patients with STEMI from SCAD. (b) Correlation between DEGs and immune cell distribution. The diagram visualized the correlation matrix of DEGs, neutrophils, and monocytes distribution; the correlation was represented with color from −1 (red) to 1 (blue); blank boxes indicated the correlation was not significant (P > 0.01); (c) PCA with the expression of CLEC4E and NAMPTL and neutrophils distribution
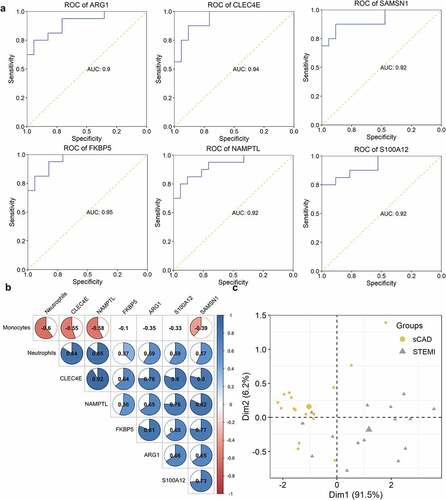
Figure 4. WGCNA analysis of STEMI. The mean connectivity and scale independence value as a function of soft threshold (power) were depicted (a, b); the red line indicated the cutoff of scale independence of 0.9. (c) Clustering dendrogram of modules; red line indicates the threshold of merging modules. (d) Modules before or after merging and clustering. (e) The heatmap depicted the correlation scores (digit in the box above) as well as its corresponding P-value (digit in the box below) of modules (rows) and clinical traits (columns). The correlation of module membership and gene significance, as well as the correlation among all genes, were visualized in (f) and (g)
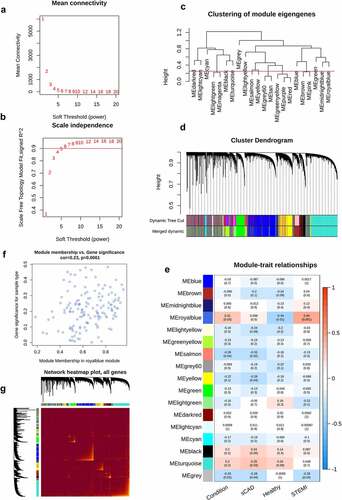
Table 1. GO enrichment terms of genes associated with AMI
Table 2. Enriched KEGG pathways of genes associated with AMI
Figure 5. Functional enrichment of STEMI-related genes. Top 6 enriched GO terms in biological process (BP), cellular component (CC), and molecular function (MF) were depicted with bar plots (a, b, c); top 12 enriched KEGG pathways were visualized with bubble plots (d)
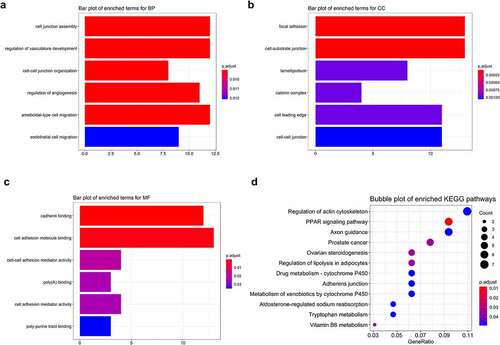
Figure 6. Protein–protein interactions and hub genes of STEMI-related genes. (a) Protein–protein interactions of STEMI-associated genes; (b) represented the top 10 predicted hub genes with Cytoscape software
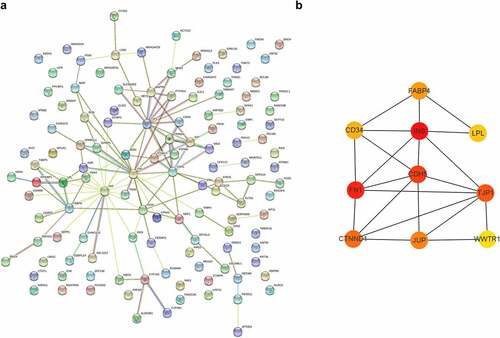
Figure 7. ROC of hub genes in distinguishing patients with STEMI from healthy controls. The ability of hub genes as reporters for patients with STEMI was visualized
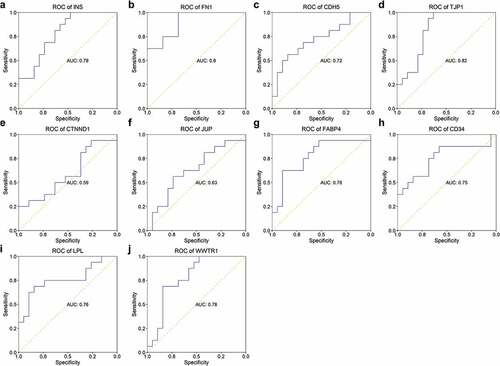
Figure 8. ROC of hub genes in separating patients with STEMI from SCAD. The AUC of 10 hub genes in identifying STEMI from SCAD was depicted
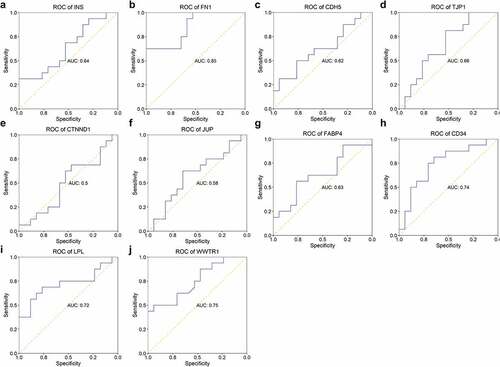
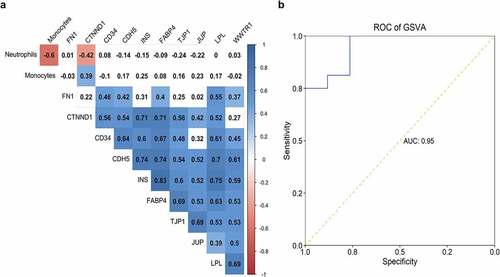
Figure 9. Correlation of hub genes and distribution of two immune cells. The correlation table indicated the association of gene expression and fractions of monocytes and neutrophils; the correlation was color-coded from −1 (red) to 1 (blue); association without significance (P-value > 0.01) was blank. (b) The capability of GSVA index of ARG1, NAMPTL, and FN1 expression and neutrophils distribution in identifying patients with STEMI from SCAD was depicted