Figures & data
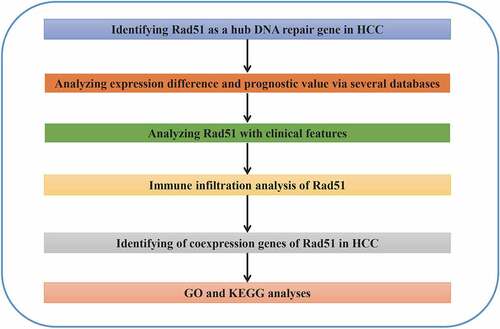
Figure 1. Flowchart of filtration process to identify target genes
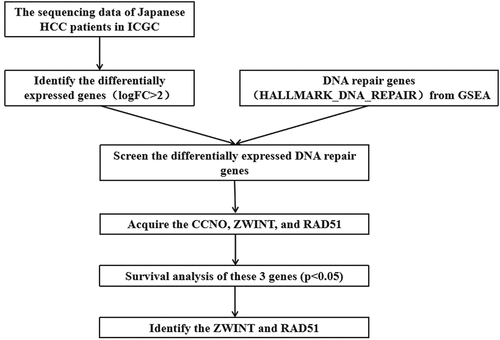
Figure 2. Differentially expressed DNA repair genes. A. Heatmap of the screened genes. B. Survival analysis of Rad51 in the patient with HCC from ICGC cohort
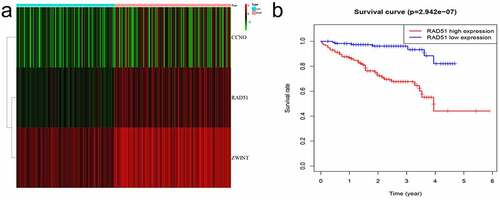
Figure 3. The expression level and survival analysis of Rad51 in HCC. A. The expression level of Rad51 in HCC from TCGA cohort. B. The expression level of Rad51 in HCC from GEPIA database. C. The protein expression of Rad51 in HCC from HPA database. D-G. Survival analysis of OS, RFS, PFS and DSS (n = 364, n = 316, n = 370, n = 362) in liver cancer
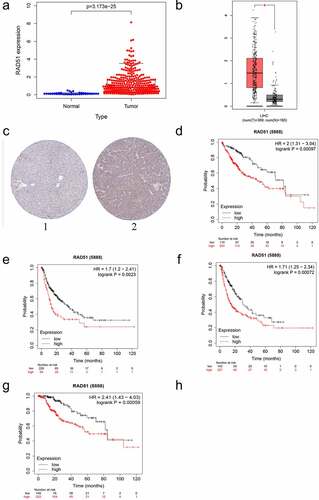
Figure 4. The prognostic value of Rad51 in HCC. Expression of Rad51 correlated significantly with clinical stage (a), pathologic T stage (b), grade (c) and age (d). Univariate COX analysis (e) and multivariate COX analysis (f) revealed the correlation between Rad51 and clinicopathological features in HCC patients
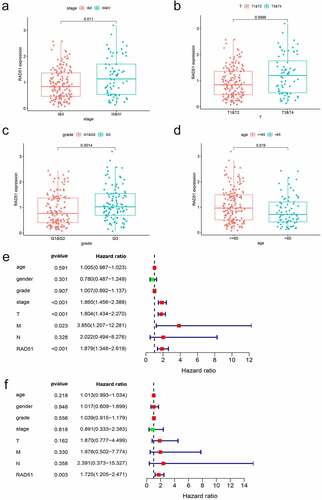
Table 1. Kaplan-Meier plotter to determine the effect of different clinicopathologic variables on the expression of Rad51 gene and clinical prognosis in HCC
Figure 5. The relationship between Rad51 expression levels and immune filtrates in HCC. A. Rad51 expression level is significantly positive correlated with immune cells. Correlation analysis between Rad51 expression and immunological markers in HCC: B. Monocyte; C. T cell (general); D. Treg; E. T cell exhaustion
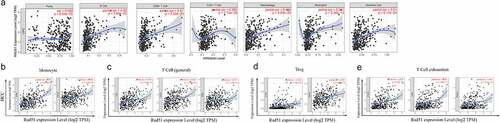
Table 2. Correlation analysis between Rad51 and relate genes and markers of immune cells in TIMER
Table 3. Correlation analysis between Rad51 and relate genes and markers of monocyte, T(general), Treg and T Cell exhaustion in GEPIA
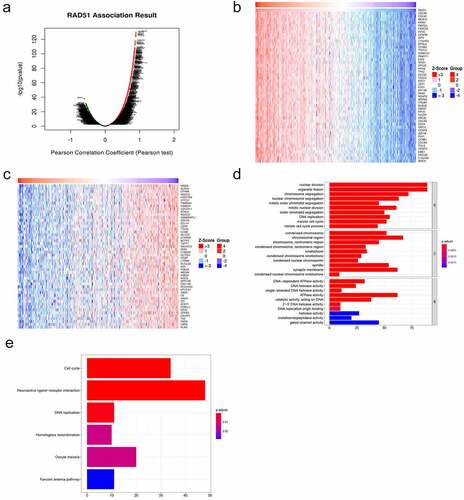
Figure 6. Functional enrichment analysis of differentially co-expressed genes of Rad51 in HCC. A. Volcano plots of differentially co-expressed genes of Rad51. The heatmap visualized the top 50 positively (b) and negatively (c) differentially co-expressed genes. GO terms of biological process (d), cell component (e) and molecular function(f)