Figures & data
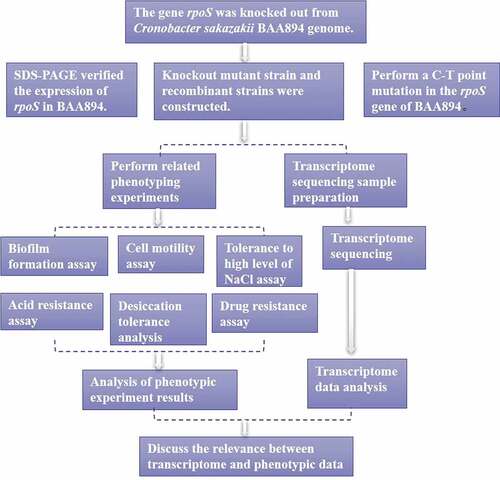
Table 1. Strains and plasmids used in this study
Table 2. Primers for PCR amplification used in this study
Figure 1. rpoS gene knockout procedure in C. sakazakii BAA894
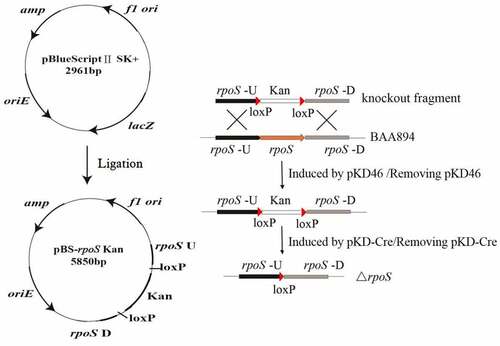
Figure 2. Protein Tris-SDS-PAGE electrophoresis of overexpressing strains
Figure 3. Analysis of the biofilm formation among the BAA894, mutant ΔrpoS and recombinant strain rpoSW
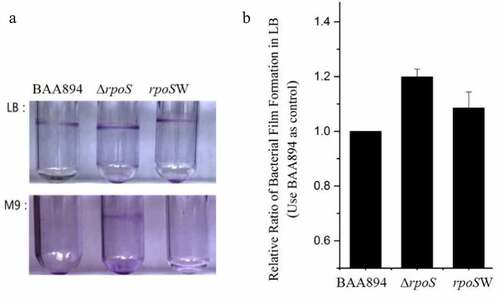
Figure 4. Swimming motility of the wild-type, rpoS null mutant and expression recombinant strains on M9 or LB medium
Figure 5. Osmotic tolerance of wild-type BAA894, ΔrpoS mutant strain
Figure 6. Growth curves and the extracellular pH changed curves of BAA894 and rpoS null mutant ΔrpoS in M9 medium
Figure 7. Desiccation tolerance of the wild type (WT), rpoS null mutant strains ΔrpoS and complementation strains rpoSW on (a) LB and (b) M9 medium
Figure 8. MIC determination of different antibiotics for BAA894, ΔrpoS in different cultural media. (a) LB and (b) M9
Figure 9. KEGG pathway cluster analysis of differently expressed genes in ΔrpoS, using BAA894 as a control
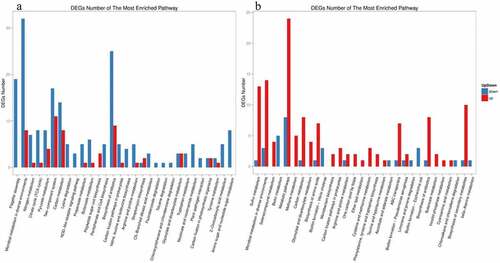
Figure 10. (a) Transcriptional ratios of the genes relevant to KEGG pathway significantly enriched in LB medium. (1): Flagellar assembly, (2): Bacteria chemotaxis, (3): Quorum sensing, (4): ABC transport. (b) Transcriptional ratios of the genes relevant to KEGG pathway significantly enriched in M9 medium. (1): membrane transport, (2): Signal transduction. (c) Transcriptional ratios of the genes relevant to Microbial metabolism in diverse environments in LB (1) and M9 (2). Log2R represents the ratio of gene expression in the mutant strain ΔrpoS versus the same gene in the BAA894 wild strain at logarithmic scale to base 2