Figures & data
Figure 1. The expression of PLK1 was suppressed in myocardium of rats suffered from the ischemia reperfusion. (a, b) the mRNA and protein expression of PLK1 in myocardium of rats detected by RT-PCR and western blotting. (c, d) the expression of PLK1 in H9c2 cells determined by RT-PCR and western blotting. **p < 0.01
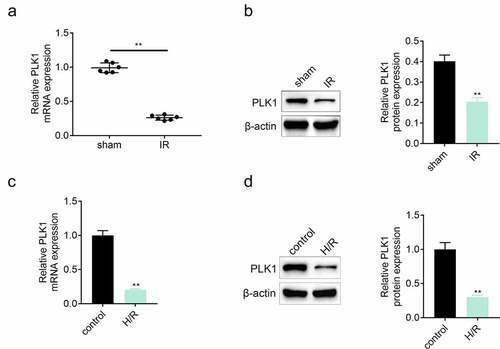
Figure 2. Overexpression of PLK1 relieved the ischemia reperfusion induced myocardial infarction of rats. (a) Western blot analysis of the expression of PLK1 in myocardium of rats determined by. (b) the myocardial infarction area detected by evans blue staining. (c) the levels of LDH in the serum of rats determined by ELISA. (d) Western blot analysis of the expression of PLK1 in H9c2 cells. (e) the survival rates of H9c2 cells detected by CCK-8 assay. (f) the levels of GSH, GPX and SOD in H9c2 cells detected by ELISA. ## p < 0.01 IR+Ad-PLK1 vs IR+Ad-NC, **p < 0.01 sham+Ad-NC vs IR+Ad-NC
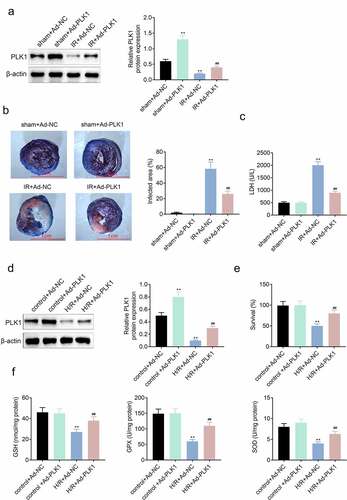
Figure 3. Overexpression of PLK1 relieved the ischemia reperfusion induced apoptosis of myocardium of rats. (a) the apoptosis of myocardium detected by tunel staining. (b) Western blot analysis of the expression of apoptosis related proteins in myocardium. (c) flow cytometry analysis of the apoptosis of H9c2 cells by. (d) Western blot analysis of the expression of apoptosis related proteins in H9c2 cells. ##p < 0.01 IR+Ad-PLK1 vs IR+Ad-NC, **p < 0.01 sham+Ad-NC vs IR+Ad-NC
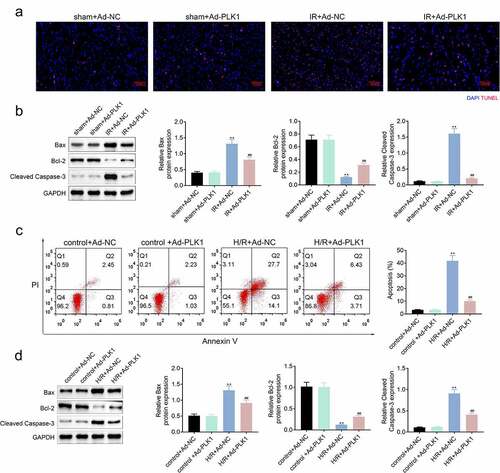
Figure 4. Overexpression of PLK1 induced the mitophagy of myocardium of rats suffered from the ischemia reperfusion. (a, b) Western blot analysis of the expression of mitophagy related proteins in myocardium of rats and H9c2 cells. (c) Immunofluorescence analysis of the location of mitochondrion and lysosome in H9c2 cells. (d) The production of ATP in H9c2 cells determined by ELISA. ##p < 0.01 IR+Ad-PLK1 vs IR+Ad-NC, **p < 0.01 sham+Ad-NC vs IR+Ad-NC
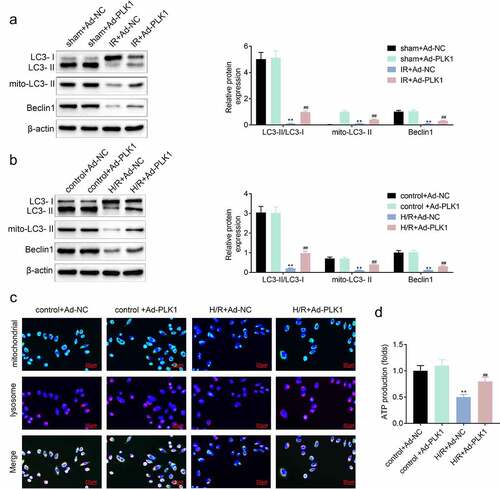
Figure 5. Overexpression of PLK1 activated the expression of p-AMPK in H9c2 cells. (a) Western blot analysis of the expression of p-AMPK and AMPK in H9c2 cells. (b) Western blot analysis of the levels of p-AMPK and FUNDC1 in H9c2 cells. ##p < 0.01 H/R+ Ad-PLK1 vs H/R+ Ad-NC, &&p < 0.01 H/R+ Ad-NC vs control, **p < 0.01 H/R+ Ad-PLK1 + 10 μmol/L CC vs H/R+ Ad-PLK1
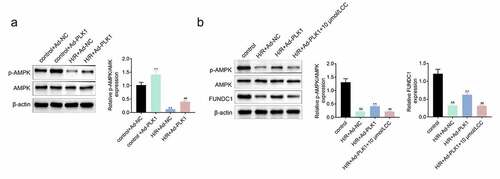
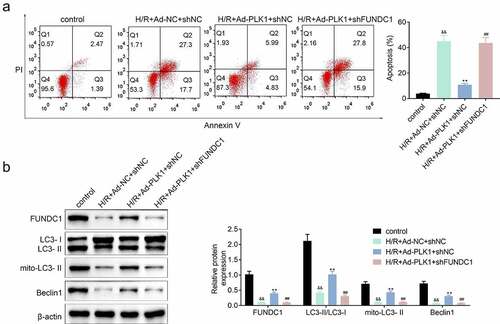
Figure 6. Inhibition of FUNDC1 abolished the effect of PLK1 overexpression on the mitophagy of H9c2 cells. (a) flow cytometry analysis of the apoptosis of H9c2 cells . (b) Western blot analysis of the expression of mitophagy related proteins in H9c2 cells. ##p < 0.01 H/R+ Ad-PLK1+ shFUNDC1 vs H/R+ Ad-PLK1+ shNC, &&p < 0.01 H/R+ Ad-NC+shNC vs control, **p < 0.01 H/R+ Ad-NC+shNC vs H/R+ Ad-PLK1+ shNC