Figures & data
Figure 1. Expression profiles of 159 T-cell-labeled genes within 22 different immune cell subtypes (a); expression profiles of 153 T-cell-labeled genes across colon cancer cohort (b); ITA correlation comparison with 50 pathways (c); plot illustrating the correlation between EMT and ITA (d)
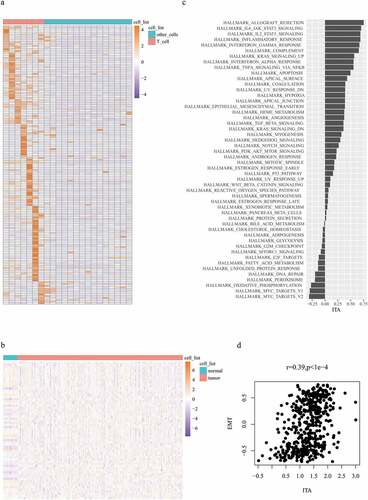
Figure 2. Plot illustrating the correlation between adjusted EMT and tumor purity (a); plot depicting the correlation between adjusted ITA and tumor purity (b); plot highlighting the adjusted EMT and ITA correlation (c)
Figure 3. Survival analysis of the original EMT grouping (a); survival analysis of the original ITA grouping (b); survival analysis of the adjusted EMT grouping (c); survival analysis of the adjusted ITA grouping (d)
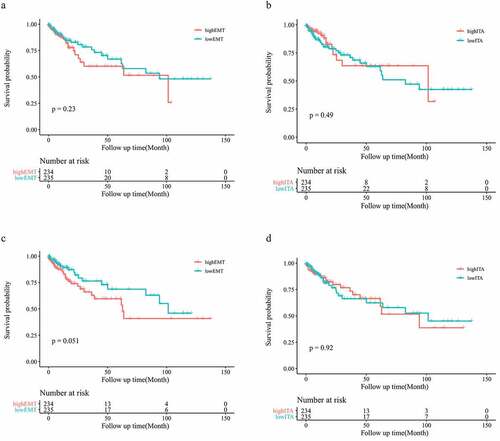
Figure 4. Survival analysis of the original EMT-ITA (a); survival analysis of the adjusted EMT-ITA (b)
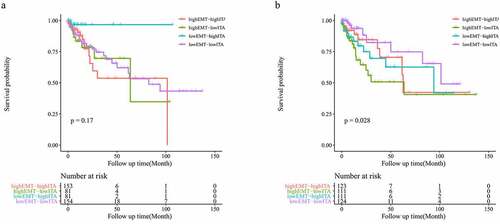
Figure 5. Individual EMT-related genes were categorized based on the significance of their association with survival (a); the Y-axis shows the −log10 P-value estimated by using the Wald test for 13 EMT-related genes in the CPH model (p < 0.05) (b)
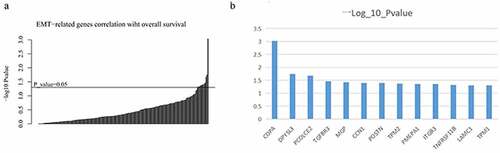
Figure 6. Seven genes are associated with prognosis in the GSE17536 cohort (a-g)
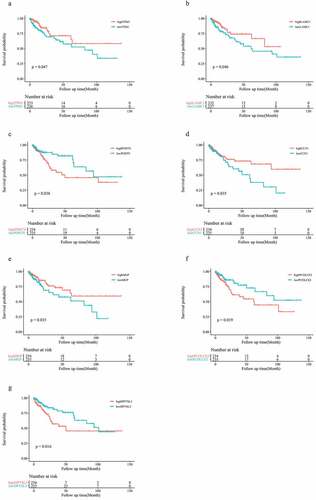
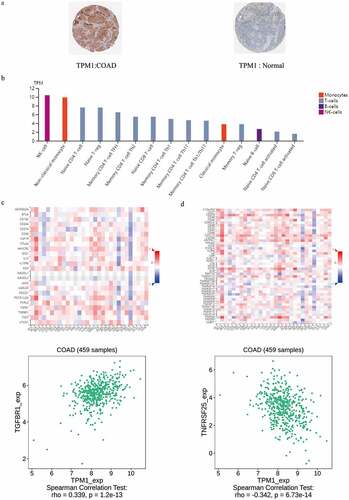
Figure 7. TPM1 expressed in colon cancer and normal (a); TPM1 expressed in different types and stages of immune cells (b); correlation coefficients between expression of TPM1 and immunomodulators (indicated on the Y axis) across various types of human cancers (indicated on the X axis; c); correlation coefficients between expression of TPM1 and immunomodulators (indicated on the Y axis) across various types of human cancers (indicated on the X axis; d)