Figures & data
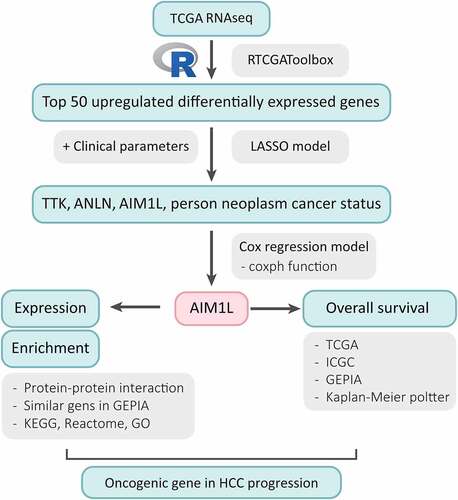
Figure 1. Differentially expressed genes (DEGs) between tumor and nontumor tissues in HCC patients in TCGA dataset were screened the ‘getDiffExpressedGenes’ function in RTCGAToolbox package with criteria P value < 0.05, adjusted P value < 0.05 and logFC ≥ 2. Top 50 upregulated DEGs was obtained for heatmap performance when ‘hmTopUpN’ equals to 50 and ‘hmTopDownN’ equals to 0
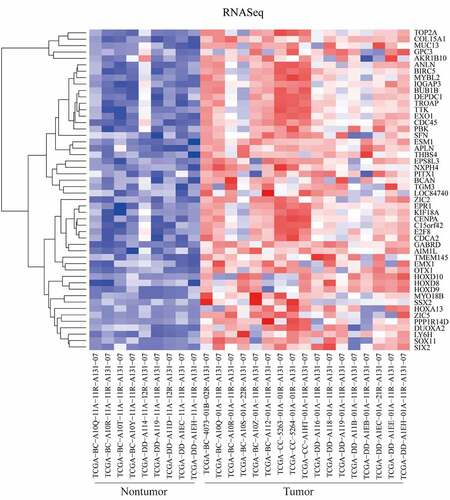
Figure 2. Parameter selection through LASSO regression (a) and elucidation of LASSO coefficient profiles for selected factors (b)
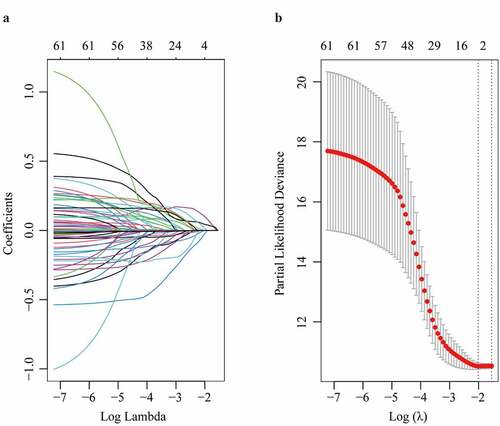
Figure 3. Cox proportional hazards regression model using the ‘coxph’ function in R program was established. Four parameters including TTK, ANLN, AIM1L, and cancer status screened by LASSO model were included in Cox regression model for OS in HCC patients. After adjusting TTK and ANLN, AIM1L and cancer status were significantly associated with OS in HCC patients (both P < 0.05)
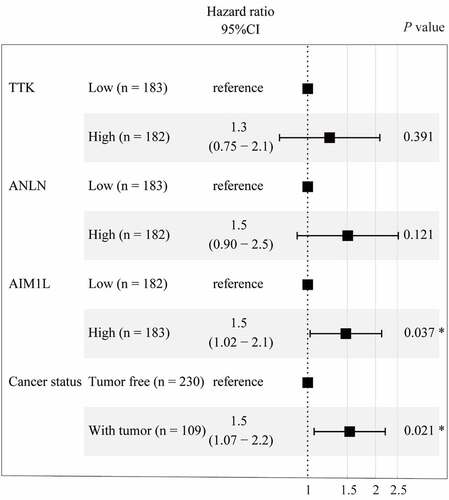
Figure 4. Through searching AIM1L in PubMed (gene ID: 55057), the gene expression levels in 27 normal tissues from Fagerberg’s dataset were obtained. In Consensus dataset in GEPIA database, normalized expression (NX) of AIM1L from three transcriptomics datasets, namely, Human Protein Atlas (HPA), the Genotype-Tissue Expression (GTEx) project and the Functional Annotation of Mammalian Genomes 5 (FANTOM5) project, was calculated. AIM1L is at low levels in normal liver both in Fagerberg’s dataset (a) and Consensus dataset from HPA (b). In HPA database, single cell RNA sequencing indicated that AIM1L was not detected in Hepatocytes, Cholangiocytes, Endothelial cells, Erythroid cells, Ito cells, Kupffer cells, T cells and B cells in liver tissue (c)
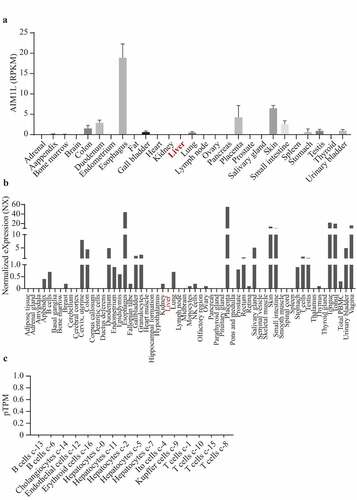
Figure 5. AIM1L expression between tumor and nontumor samples in HCC patients were compared. AIM1L was significantly upregulated tumor tissues in TCGA (P < 0.0001, A), in 50 paired tumor samples from TCGA (P < 0.0001, B), in LIRI-JP project from ICGC (P < 0.0001, C) and in GEO series including GSE45436, GSE55092, GSE84402, GSE101685, GSE14323, GSE112790, and GSE121248 (all P < 0.0001, D). In a rat model naturally occurring hepatotumorigenesis induced by oxidative stress, AIM1L was significantly upregulated in liver cancer tissues compared to normal liver tissues (P < 0.01, E)
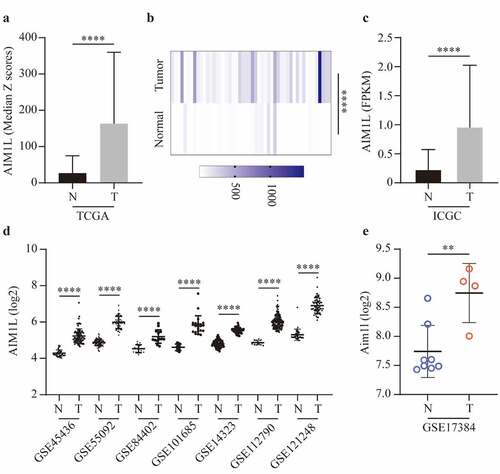
Figure 6. Associations between AIM1L and HCC survival. Kapan-Meier plot method indicated that HCC patients with AIM1L overexpression in tumor tissues had unfavorable OS compared to those with low levels of AIM1L in TCGA dataset (Log rank P = 0.041, A), ICGC dataset (Log rank P = 0.046, B), GEPIA (HR = 1.5, Log rank P = 0.02, C) and Kapan-Meier plotter (HR = 1.64, 95% CI = 1.16–2.33, Log rank P = 0.041, D) datasets
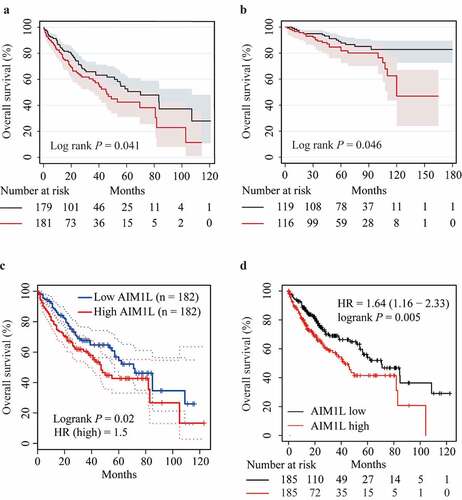
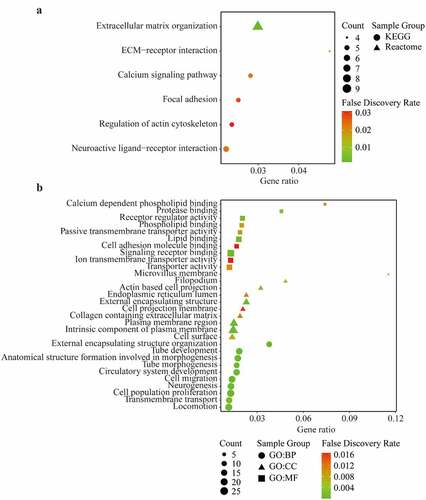
Figure 7. KEGG pathway, Reactome (a) and Gene Ontology (GO) enrichment (b) including Biological process (BP), Cellular component (CC), and Molecular function (MF) of differentially expressed related-genes of AIM1L screened by edgeR package in TCGA dataset with a |log FC| > 1, and adjusted P value < 0.05. Top ten genesets were addressed with a false discovery rate (FDR) q-value < 0.05