Figures & data
Figure 1. Flow chart of this research
Figure 2. The differentially expressed genes in gastric cancer
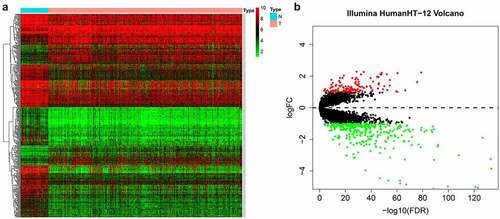
Figure 3. Functional enrichment analysis of the DEGs
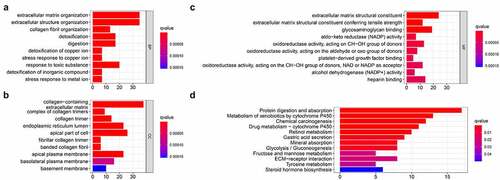
Figure 4. Prognosis-related gene screening
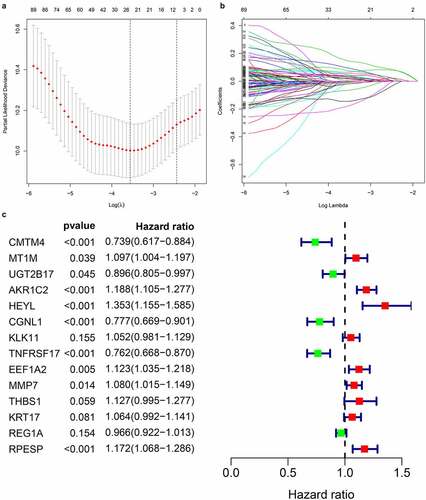
Figure 5. Prognostic analysis of 14-genes signature in the train cohort
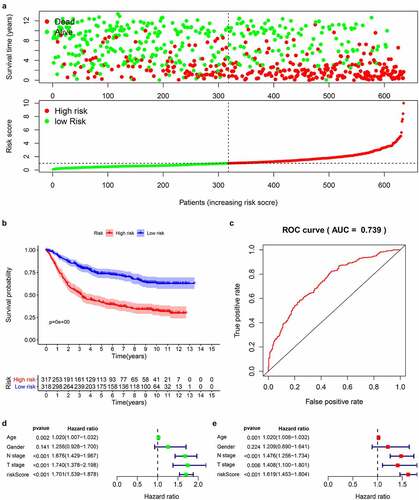
Figure 6. Prognostic analysis of 14 genes signature in the GSE15459 data set
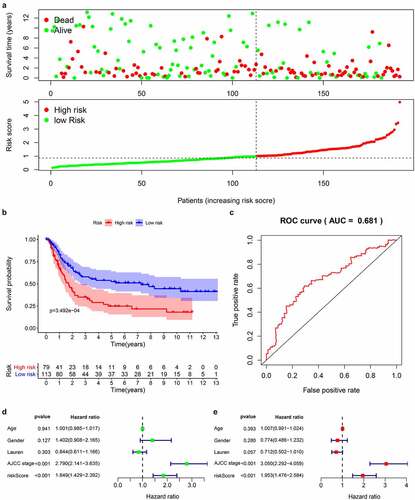
Figure 7. Risk and clinicopathological characteristics of 14 genes
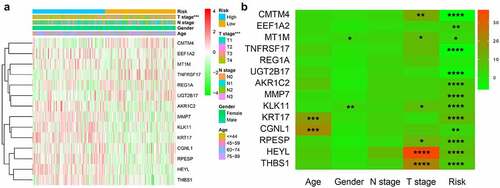
Figure 8. High-risk group conducts GSEA enrichment pathway analysis
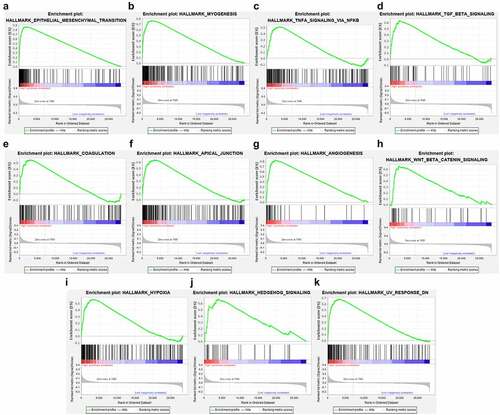
Figure 9. Establishment and validation of Nomogram (a) Nomogram for predicting 1–5 years OS of GC patients. (b) calibration chart for nomogram accuracy
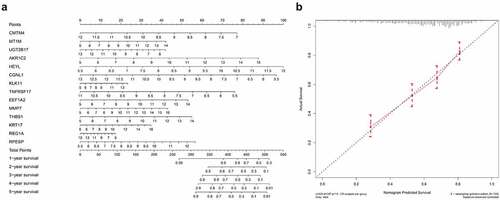
Figure 10. Verification of 14 genes expression in GC and normal gastric tissue using the HPA database
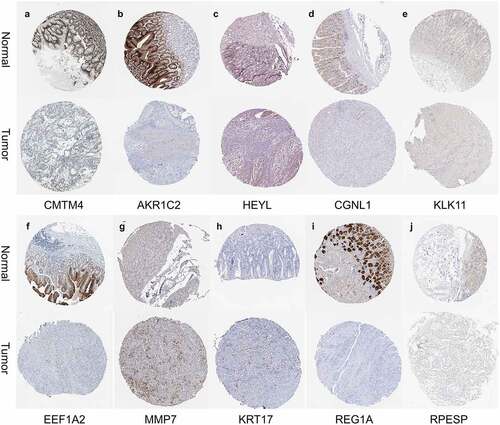
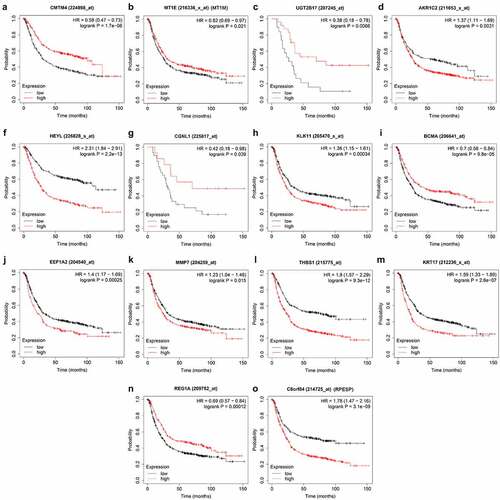
Figure 11. Validation the prognostic value of 14 genes in GC by Kaplan Meier-plotter