Figures & data
Figure 1. We analyzed various databases to obtain cullin-5 (CUL5) expression data. (a) TIMER2 analysis indicated that different cancers and specific cancer subtypes affect the CUL5 gene expression status. Samples with gray backgrounds represent both tumor and normal tissue samples, which can be compared statistically. Samples with white backgrounds represent only tumor samples, which cannot be compared statistically (*P < 0.05; **P < 0.01; ***P < 0.001). (b) We used normal tissue data on CHOL (cholangiocarcinoma), DLBC (diffuse large B cell lymphoma), and THYM (thymoma) from the Genotype-Tissue Expression database as controls for comparisons with the corresponding data from The Cancer Genome Atlas (TCGA) project, which are presented as a box plot (*P < 0.05). (c) Expression levels were also compared between tumor tissue and normal tissue of CUL5 proteins in breast cancer, colon cancer, LUAD (lung adenocarcinoma), UCEC (uterine corpus endometrial carcinoma), clear cell renal cell carcinoma, and ovarian cancer based on the CPTAC data set (***P < 0.001). (d) We analyzed the prime pathological stages (stages I to IV) to identify CUL5 gene expression levels for ACC (adrenocortical carcinoma), THCA (thyroid carcinoma), LIHC (liver hepatocellular carcinoma), and SKCM (skin cutaneous carcinoma) based on TCGA data. The logarithmic scale was produced using log2 TPM + 1
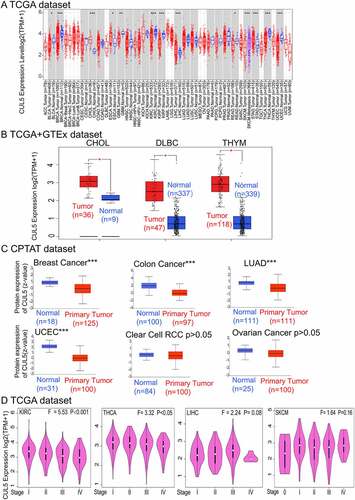
Figure 2. We used TCGA database to discover the relationships between CUL5 gene expression and the prognoses in various cancers. The Gene Expression Profiling Interactive Analysis 2nd Edition (GEPIA2) database was used to analyze different tumors in TCGA project for (a) overall survival (OS) in CUL5 gene expression and (b) disease-free survival (DFS) analyses. OS is the time from the onset of a condition onset to death from any cause. DFS is the time from onset to the first tumor recurrence/metastasis or death from any cause. Progression-free survival is the time from onset to the first tumor progression or death. Blue and red square in the picture show negative and positive associations of CUL5 gene expression with the prognosis, respectively. Positive results for survival and Kaplan-Meier curves are shown. The receiver operating characteristics (ROC) curve between CUL5 and tumor prognosis was plotted based on data from TCGA database. (c) The areas under the ROC curves for cholangiocarcinoma (CHOL), kidney renal clear cell carcinoma (KIRC), rectum adenocarcinoma (READ), and adrenocortical carcinoma were 0.985, 0.813, 0.725, and 0.821, respectively, indicating a high predictive value for tumor prognosis
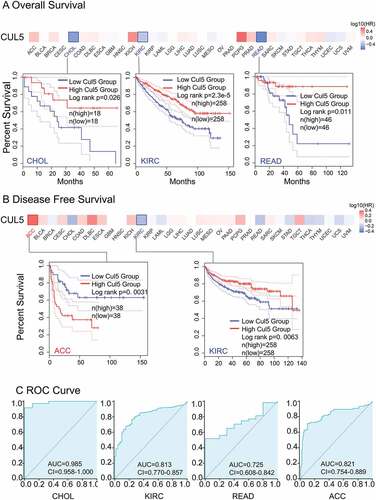
Figure 3. TCGA was used to obtain the mutation effect of CUL5 on different tumors via the cBioPortal. This figure displays (a) the alteration frequency in different mutation molds, (b) mutation sites, and (c) the potential links between mutation condition and versions of KIRC survival curves, as obtained using the cBioPortal tool
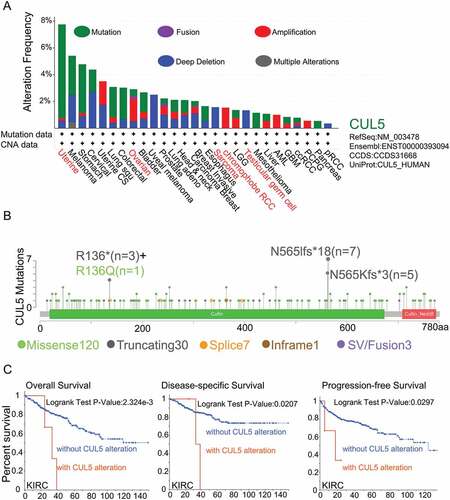
Figure 4. Links between CUL5 expression and CD8 + T immune cells. We used various algorithms to identify any links between CUL5 expression and immune cells. Within whole cancer types in TCGA project, we explored the expression level of CUL5 and the CD8 + T-cell infiltration status (a, b)
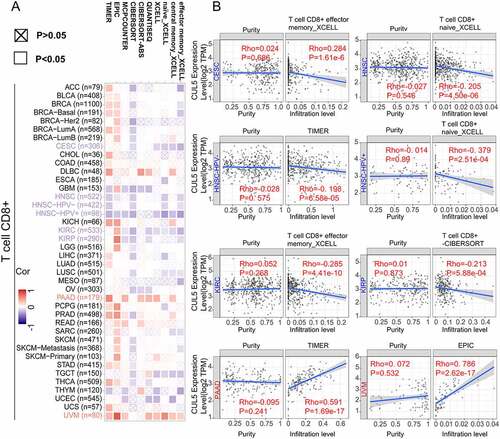
Figure 5. Gene Set Variation Analysis (GSVA) of CUL5 enrichment and immune cells. RNA-seq data and clinical data were extracted in the Level 3 HTSeq-FPKM format from TCGA database, and Spearman’s rank correlation test was performed using the GSVA package of R software to analyze the correlation of each tumor’s immune cells. (a) Enrichment analysis of the immune cell relationship between CUL5 and breast invasive carcinoma, COAD, diffuse large-B-cell lymphoma, KICH, KIRC, KIRP, LAML, liver hepatocellular carcinoma, LUAD, MESO, OV, and pancreatic adenocarcinoma. (b) Enrichment analysis of the immune cell relationship between CUL5 and PCPG, PRAD, READ, sarcoma, SKCM, stomach adenocarcinoma, TGCT, thyroid carcinoma, THYM, UCEC, UCS, and uveal melanoma
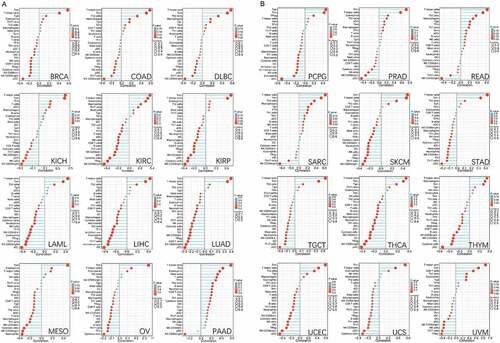
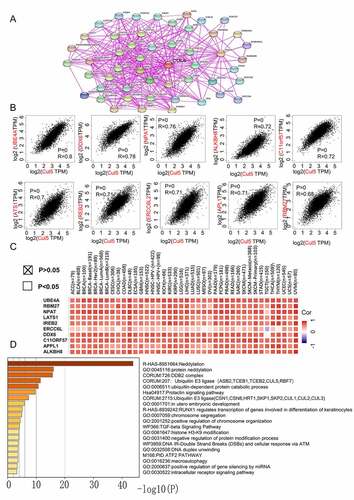
Figure 6. Analysis of genes and proteins relevant to CUL5. (a) The available CUL5-binding proteins determined by the experiment, obtained using the STRING tool. (b) The top 10 genes that were most strongly related to CUL5 from TCGA database, and the relationships between CUL5 expression and the following genes: ubiquitination factor e4a, dead box protein 6, nuclear protein mapped to ataxia telangiectasia locus, alkylated DNA repair protein AlkB homolog 8, chromosome 11 open reading frame 57, recombinant iron-responsive element-binding protein 2, excision repair cross-complementation group 6 like 2, adaptor protein, phosphortyrosine interaction, PH domain and leucine zipper containing 1, large tumor suppressor gene 1, and RNA-binding protein 27 obtained from the GEPIA2. (c) Detailed cancer types and the corresponding heat map data. (d) GO annotation results obtained using the Metascape platform