Figures & data
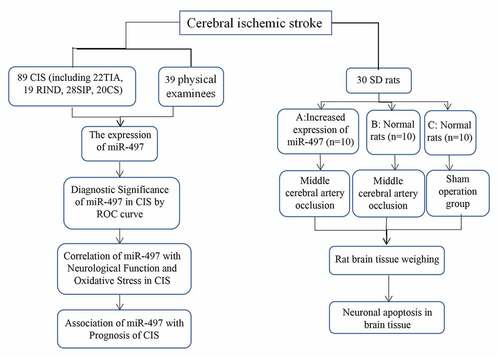
Table 1. Primer sequence
Figure 1. The flow table for this study
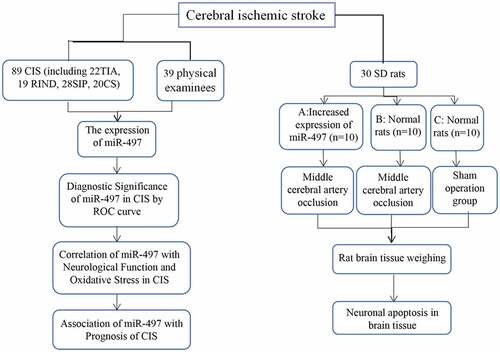
Figure 2. miR-497 expression in CIS. (a) Serum miR-497 expression in CIS patients and health examinees on admission; (b) miR-497 expression in CIS patients on admission and discharge; * P < 0.05. (c) miR-497 expression in four types of CIS patients on admission. * P < 0.05 vs. TIA; # P < 0.05 vs. RIND; @ P < 0.05 vs. SIP. (d) miR-497 expression in four types of CIS patients on discharge
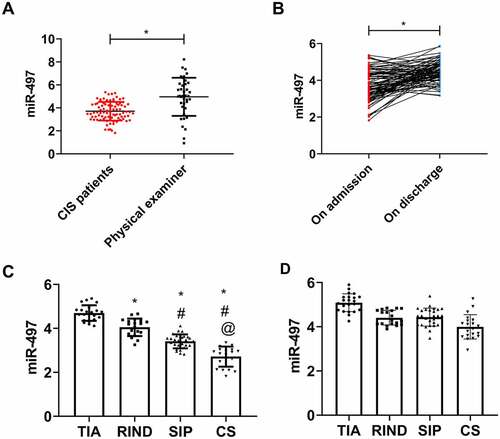
Table 2. Diagnostic significance of miR-497 in CIS by ROC analysis
Figure 3. Diagnostic significance of miR-497 in CIS. (a) ROC curve of CIS occurrence predicted by miR-497. (b) ROC curve of TIA occurrence predicted by miR-497. (c) ROC curve of RIND occurrence predicted by miR-497. (d) ROC curve of CS occurrence predicted by miR-497. (e) ROC curve of SIE occurrence predicted by miR-497
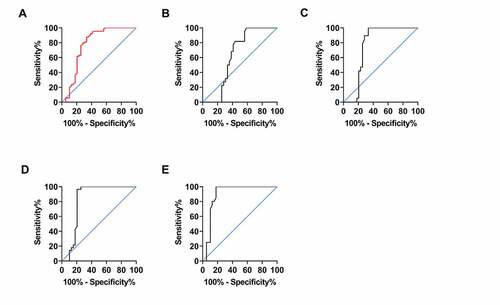
Figure 4. Correlation of miR-497 with neurological function and oxidative stress in CIS patients. (a) NIHSS scores of CIS patients on admission and discharge; (b) Serum MDA and SOD concentrations of CIS patients on admission and discharge; * P < 0.05. (c) Correlation analysis between miR-497 and NIHSS score in CIS patients on admission; (d) Correlation analysis between miR-497 and MDA concentration in CIS patients on admission; (e) Correlation analysis between miR-497 and SOD concentration in CIS patients on admission
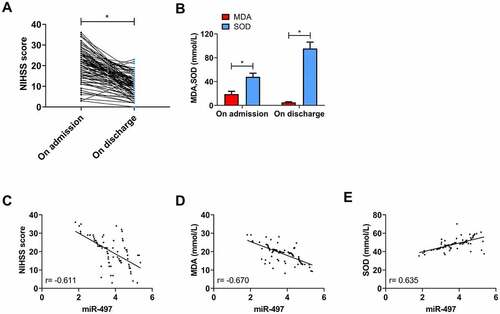
Figure 5. Association between miR-497 and prognosis of CIS patients. (a) miR-497 levels in patients with prognostic death and survival on discharge; * P < 0.05. (b) ROC curve of 3-year death predicted by miR-497 on discharge; (c) 3-year survival curves of patients in high miR-497 group and low miR-497 group; (d) miR-497 levels in patients with and without recurrence on discharge; * P < 0.05. (e) ROC curve of 3-year recurrence predicted by miR-497 on discharge
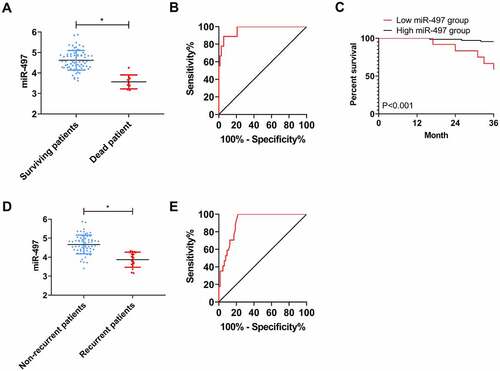
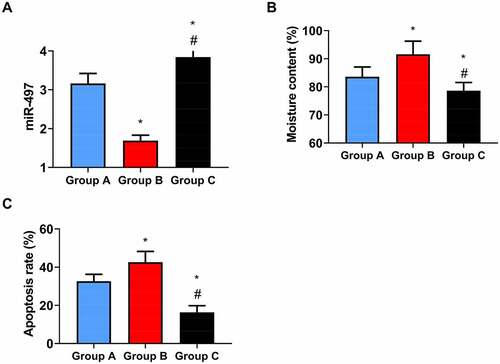
Figure 6. Impact of elevated miR-497 on CIS rats. (a) miR-497 levels in rat brain tissue in the three series; (b) Water contents of rat brain tissue in the three series; (c) Neuronal apoptosis in rat brain tissue in the three series; * P < 0.05 vs. group A, # P < 0.05 vs. group B