
Figures & data
Figure 1. LINC00511 and STAT3 expression characteristics in GC. A. The expression of LINC00511 in GC tissues was analyzed in the GEPIA database. B. LINC00511 expression in GC tissues was detected by qRT-PCR. C. Kaplan−Meier analysis of the correlation between LINC00511 expression level and the overall survival time of GC patients. D. STAT3 expression in GC tissues was detected by qRT-PCR. E. Immunohistochemical method was used to analyze the expression of STAT3 in GC samples, and two representative figures were shown (left: low LINC00511, weakly positive stain of STAT3; right: high LINC00511, strongly positive stain of STAT3), and chi-square test was used to analyze the correlation between STAT3 expression and LINC00511 expression in cancerous tissues. F. The Kaplan-Merier Plotter database was used to analyze the relationship between STAT3 expression and the overall survival time of GC patients
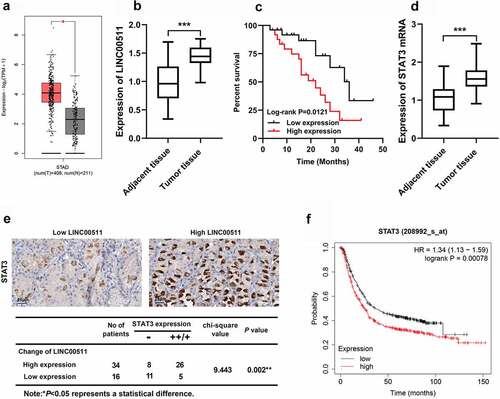
Figure 2. Effects of LINC00511 on GC cell proliferation, migration and invasion. A. qRT-PCR was adopted to detect LINC00511 expressions in GC cells and GES-1 cell line. B-C. qRT-PCR was used to detect the expression of LINC00511 after overexpression and knockdown of LINC00511. D-E. CCK-8 assay was used to detect the cell proliferation after overexpression and knockdown of LINC00511. F-G. Transwell assay was used to detect the migrative and invasive abilities of GC cells after overexpression and knockdown of LINC00511
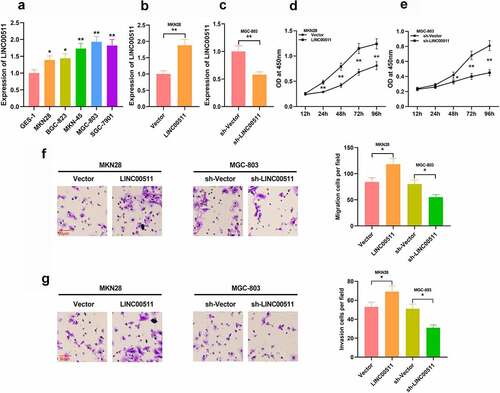
Figure 3. There is a targeted relationship between LINC00511 and miR-625-5p. A-B. qRT-PCR was used to detect the level of miR-625-5p in GC tissues and cell lines. C. Through bioinformatics analysis, it was found that LINC00511 contained a potential binding site for miR-625-5p. D. Pearson’s correlation analysis was used to detect the correlation between LINC00511 and miR-625-5p in tissues. E. The interaction between LINC00511 and miR-625-5p was validated by dual-luciferase reporter gene assay. F-G. qRT-PCR was used to detect the expression of miR-625-5p after overexpression and knockdown of LINC00511 in MKN28 and MGC-803 cells
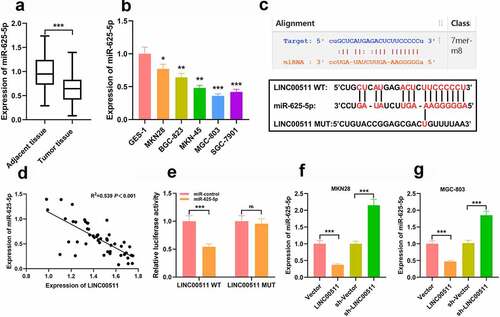
Figure 4. Effects of miR-625-5p on GC cell proliferation, migration and invasion. A-B. qRT-PCR was used to detect the expression of miR-625-5p after transfection of miR-625-5p mimics and inhibitors. C-D. The proliferation of cells transfected with miR-625-5p mimic and inhibitor was detected by CCK-8 method. E-F. Transwell assay was used to detect the migration and invasion of GC cells transfected with miR-625-5p mimic and inhibitor
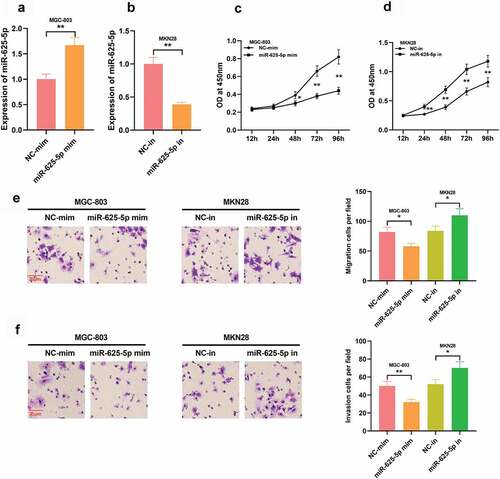
Figure 5. STAT3 is the functional target of miR-625-5p. A. Through StarBase database, it was found that the 3ʹUTR of STAT3 contained a potential binding site of miR-625-5p. B. Pearson’s correlation analysis was used to detect the correlation between STAT3 expression and miR-625-5p expression in GC tissues. C. Dual-luciferase reporter gene assay was used to validate the relationship between STAT3 and miR-625-5p. D-E. Western blot was used to detect the expression of STAT3 in GC cells transfected with miR-625-5p mimic and inhibitor, and the expression of STAT3 in GC cells transfected with LINC00511 overexpression and knockdown
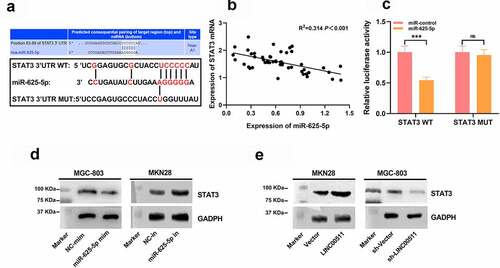
Figure 6. LINC00511 modulates the proliferation, migration and invasion of GC cell through regulating miR-625-5p. A-C qRT-PCR was used to detect the expression of LINC00511, miR-625-5p and STAT3 mRNA after transfection of miR-625-5p mimic into MKN28 cells with LINC00511 overexpression. D. CCK-8 method was used to detect the cell proliferation after transfection of miR-625-5p mimic into MKN28 cells with LINC00511 overexpression. E. MiR-625-5p mimic was transfected into MKN28 cells with LINC00511 overexpression, and the migration and invasion of the cells were detected by transwell assay
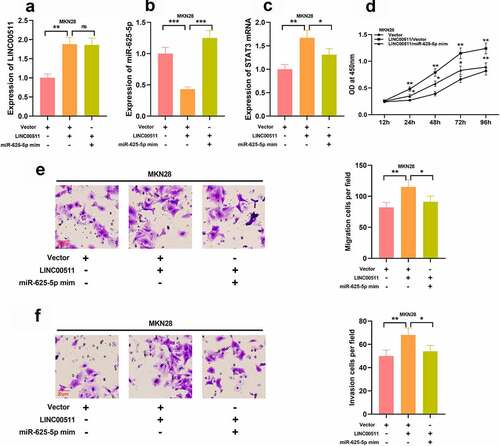
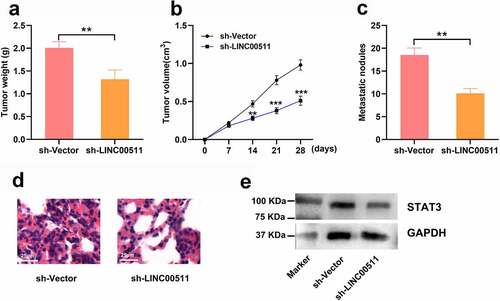
Figure 7. LINC00511 knockdown suppresses the tumor growth and lung metastasis of GC cells in vivo. A. MGC-803 cells with LINC00511 knockdown or the control cells were inoculated into the mice subcutaneously, respectively, and after the mice were sacrificed, the the tumor weight of the mice was measured (n = 5 in each group). B. Tumor volume of the mice in both groups was measured every 7 days (n = 5 in each group). C. MGC-803 cells with LINC00511 knockdown or the control cells were injected into the mice via tail vain, respectively, and after the mice were sacrificed, the number of metastatic nodules in the lung tissues of the mice was examined (n = 5 in each group). D. H&E staining was used to evaluate the metastasis of MCG-803 cells in the lung tissues sections (scale bar = 25 μm). E. Western blot assay was used to detect the expression of STAT3 in the tumor tissues of both groups
Supplemental Material
Download ()Data availability statement
The data used to support the findings of this study are available from the corresponding author upon request.