Figures & data
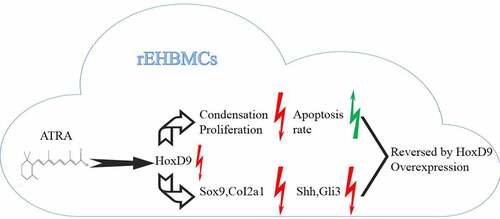
Table 1. Sequences for real-time PCR primers
Figure 1. ATRA suppresses chondrogenesis of rEHBMCs. (a) and (b) rEHBMCs were treated with ATRA at the indicated concentrations and stained with Alcian blue following 24 h of culture (magnification, x100). Quantification of chondrogenesis was determined by measuring the area of blue staining. (c) Cell proliferation was examined at 0–48 h by CCK-8 assay after treatment of rEHBMCs with ATRA as indicated. Data are shown as the means ± SD of at least three independent experiments. aP < 0.05 vs control group
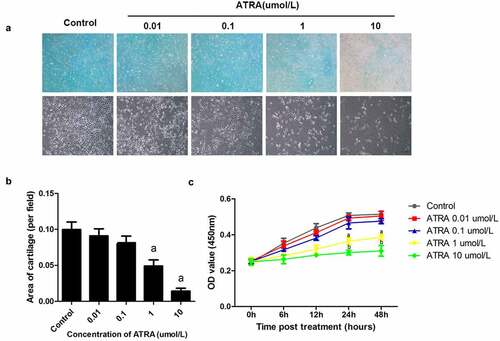
Figure 2. ATRA enhances apoptotic cell death of rEHBMCs. (a) and (b) rEHBMCs were treated with ATRA for 24 h at 0.01, 0.1, 1 and 10 µmol/L. Percentages of apoptotic cells were quantified by flow cytometry. (c) Apoptosis was evaluated by TUNEL staining assay. Data are shown as means ± SD of at least three independent experiments. aP < 0.05 vs control group
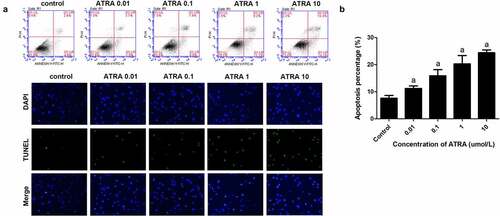
Figure 3. ATRA inhibits the expression of Sox9 and Col2a1 in rEHBMCs. rEHBMCs were treated as indicated above. (a) and (b) mRNA levels of Sox9 and Col2a1 were quantified by RT-PCR and qPCR. (c) and (d) Protein levels of Sox9 were determined by immunoblotting. (e) Col2a1 content in the culture supernatant of groups was detected by ELISA. Gene expression was normalized against GAPDH. Data in (b), (d) and (e) are shown as means ± SD of at least three independent experiments. aP < 0.05 vs control group
Figure 4. ATRA inhibits HoxD9 expression in rEHBMCs. Cells were treated as noted above. (a) Immunoblotting was used to quantify HoxD9 protein expression. Expression levels were normalized to GAPDH. (B) RT-PCR and qPCR assays were performed to quantify the mRNA levels of HoxD9, HoxD10, HoxD12 and HoxD13. Data are shown as means ± SD of at least three independent experiments. aP < 0.05 vs control group, bP < 0.01 vs control group
Figure 5. ATRA suppresses Shh-Gli3 in rEHBMCs. rEHBMCs were treated with ATRA as noted above. (a) mRNA levels of Shh and Gli3 were quantified by RT-PCR and qPCR assays. Protein expression of Shh (b) and Gli3 (c) was quantified by immunoblotting. Gene expression was normalized to GAPDH. Data are shown as means ± SD of at least three independent experiments. aP < 0.05 vs control group, bP < 0.01 vs control group
Figure 6. Overexpression of HoxD9 reverses the effect of ATRA. rEHBMCs were transfected with the HoxD9 overexpressing vector and the control vector for 24 h and then treated with ATRA for an additional 24 h. (a) qPCR was used to quantify the mRNA expression of HoxD9. (b) CCK-8 was performed to quantify proliferation. (c) Alcian blue staining was used to quantify the chondrogenesis. (d) Flow cytometry was used to quantify apoptosis of rEHBMCs. (e) ELISA was used to quantify Col2a1 expression. (f) Western blotting was performed to quantify the expression of HoxD9. aP < 0.05 vs control, bP < 0.05 vs ATRA + vector