
Figures & data
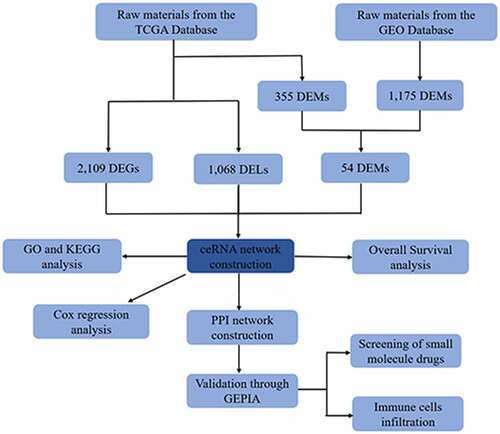
Figure 1. The flow chart of bioinformatics analysis. Caco-2, human epithelial colorectal adenocarcinoma cells; LGG, Lactobacillus rhamnosus GG; B.caccae, Bacteroides caccae; CRC, Colorectal cancer; CR, Colorectum; Fn, Fusobacterium nucleatum; GDC, Genomic Data Commons Data Portal
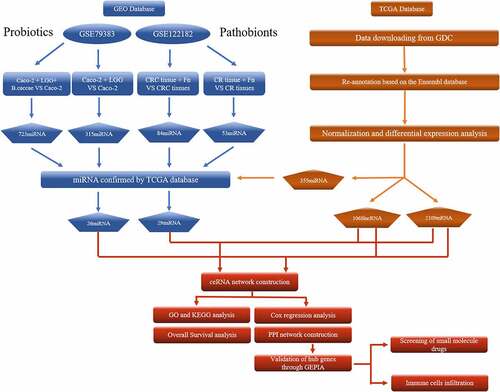
Table 1. The expression of 8 DEmiRNAs in probiotic environment from TCGA and GEO database
Table 2. The expression of 4 DEmiRNAs in pathogenic environment from TCGA and GEO database
Figure 2. Overview of lncRNA-miRNA-mRNA competing endogenous RNA (ceRNA) network in probiotics-mediated CRC. Red represents upregulation, and green represents downregulation. LncRNAs, miRNAs, and mRNAs in the networks are represented as diamonds, round rectangles, and circles, respectively. Bar plots show the key RNAs that have the top interaction number in the whole network
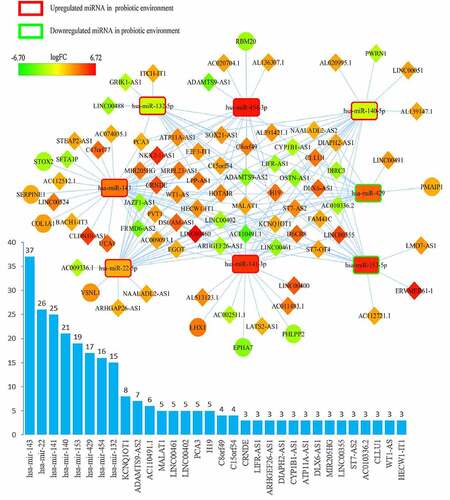
Figure 3. Overview of lncRNA-miRNA-mRNA competing endogenous RNA (ceRNA) network in pathobionts-mediated colorectal cancer. Red represents upregulation, and green represents downregulation. LncRNAs, miRNAs, and mRNAs in the networks are represented as diamonds, round rectangles, and circles, respectively. Bar plots show the key RNAs that have the top interaction number in the whole network
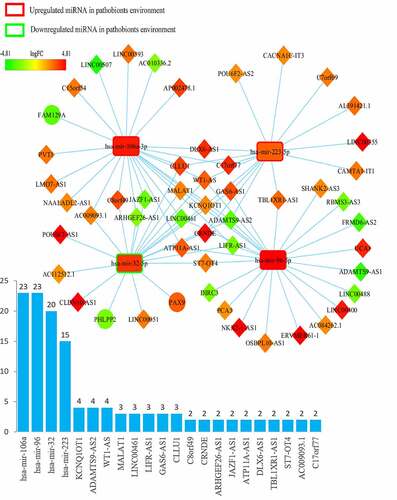
Figure 4. GO functional analysis (a) and KEGG pathway (b) analysis of differentially expressed RNAs in microbiota-mediated colorectal cancer
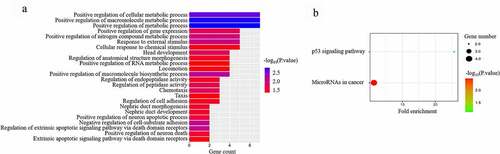
Table 3. Univariate and multivariate analysis
Figure 5. Overall survival analysis of RNAs in the ceRNA network of microbiota-mediated colorectal cancer. (a), (b) Kaplan-Meier survival curves of prognostic DELs both in probiotics-mediated ceRNA network and pathobionts-mediated ceRNA network. (c), (d) Kaplan-Meier survival curves of prognostic DELs only in proniotics-mediated ceRNA network
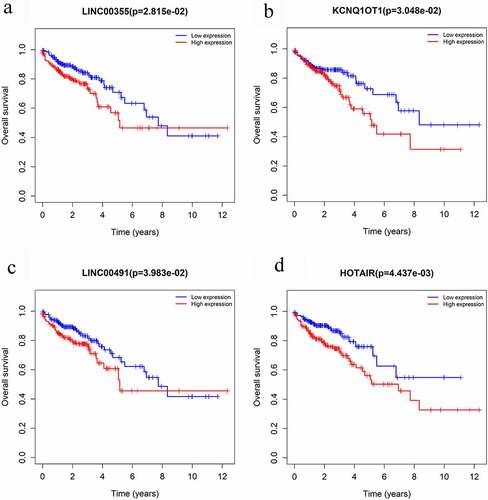
Figure 6. Protein-protein interaction network of differentially expressed RNAs in microbiota-mediated colorectal cancer, the nodes represent proteins, and the edges demonstrate the predicted functional associations between them, line thickness indicates the strength of data support
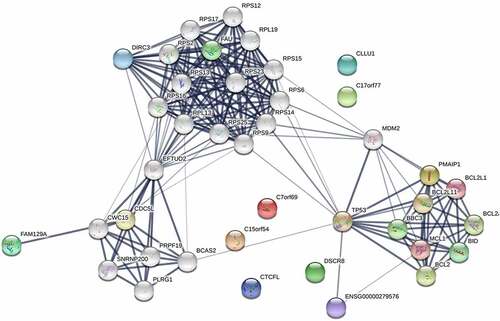
Figure 7. The expressions of 12 hub genes were determined using GEPIA. The expressions of genes are expressed as relative gene expression using transformed log2 (TPM+1) Value (Y-axis) of tumor (red bar) and normal (black bar) samples and displayed as a whisker plot. * p-value <0.05. GEIPIA, gene expression profiling interactive analysis
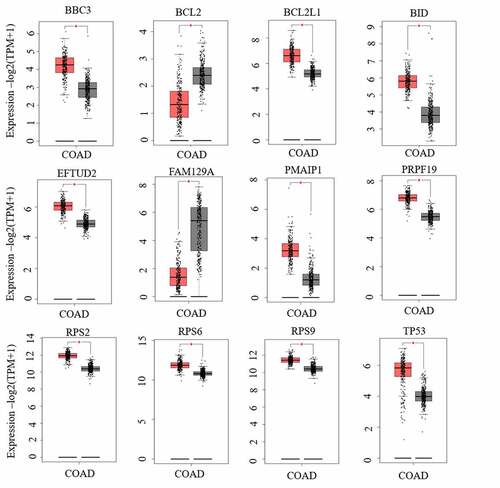
Table 4. Results of connectivity map analysis
Figure 8. Three-dimensional diagram of the three most significant candidate drugs. (a) Pentoxyverine (b) Rimexolone (c) Doxylamine
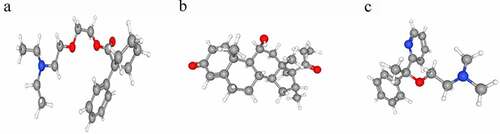
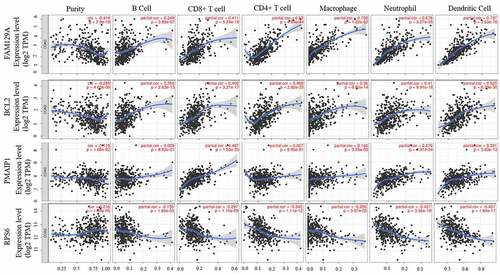
Figure 9. Integrative analysis between hub identified signature with humor-infiltrating immune cells
Supplemental Material
Download ()Data availability statement:
The datasets generated during the current study are available in the Gene Expression Omnibus repository: https://www.ncbi.nlm.nih.gov/geo/query/acc.cgi?acc=GSE79383 and https://www.ncbi.nlm.nih.gov/geo/query/acc.cgi?acc=GSE122182, and the NCI’s Genomic Data Commons Data Portal: http://portal.gdc.cancer.gov.