Figures & data
Figure 1. Identification of differentially expressed genes (DEGs) in the TCGA and GSE153659 datasets of thyroid carcinoma (THCA). The cutoff criteria were |logFC| ≥1.0 and adjusted P < 0.05. (a, b) Volcano plots of DEGs in the TCGA-THCA (a) and GSE153659 (b) datasets. (c, d) Heatmaps of the top 50 DEGs in the TCGA-THCA (c) and GSE153659 (d) datasets. Red, up-regulated DEGs; green, down-regulated DEGs
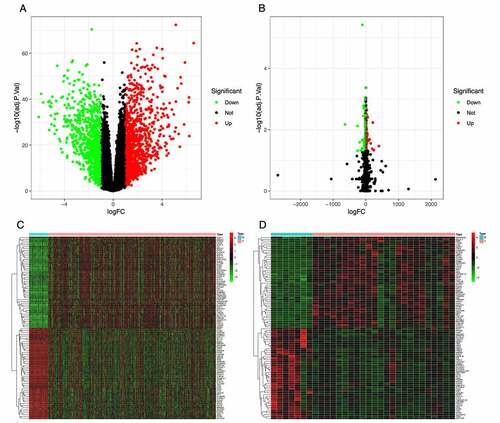
Figure 2. Identification of modules correlated with the clinical phenotype in the TCGA-THCA and GSE153659 datasets of thyroid carcinoma (THCA). (a, b) Hierarchical clustering dendrograms of module eigengenes in the TCGA-THCA (a) and GSE153659 (b) datasets. Modules below the red line indicate correlation >0.6 and will be merged. (c, d) Gene-module tree diagrams in the TCGA-THCA (c) and GSE153659 (d) datasets. Each branch represents one gene, and each of the colors below represent one co-expression module. (e, f) Module-trait relationship diagrams in the TCGA-THCA (e) and GSE153659 (f) datasets. Each row corresponds to a color module and each column corresponds to a clinical trait (tumor or normal). Each cell contains the corresponding correlation and P-value. (g, h) Analysis of the scale independence and mean connectivity for the optimal soft threshold powers (β) 2 in the TCGA-THCA (g) and 6 in the GSE153659 (h), respectively
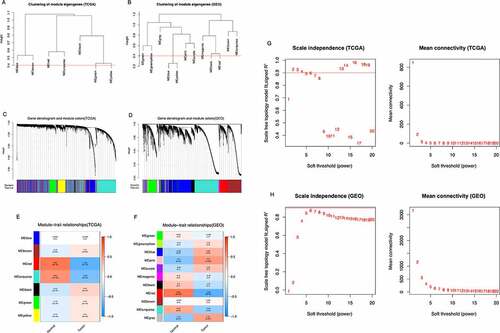
Figure 3. Venn diagrams of the differentially expressed genes (DEGs) and top two most relevant co-expression module genes (CEMGs) of thyroid carcinoma (THCA). The 162 overlapping genes were considered as candidate hub genes of THCA
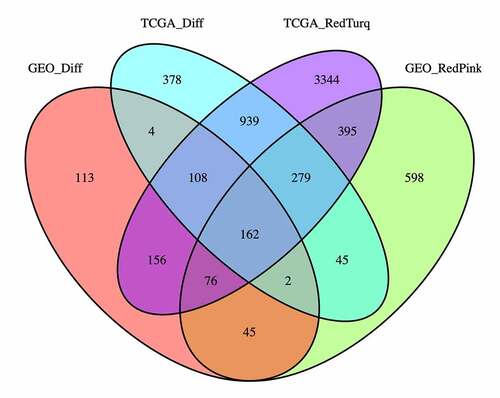
Figure 4. Bubble plots of the functional and pathway enrichment analyses the 162 overlapping genes. (a, b) Gene Ontology (GO) (a) and Kyoto Encyclopedia of Genes and Genomes (KEGG) pathway (b) enrichment analyses. The diameter of the circle indicates the number of genes, the color of the circle indicates the P-values, and the bottom transverse coordinate GeneRatio represent the proportion of the total number of genes
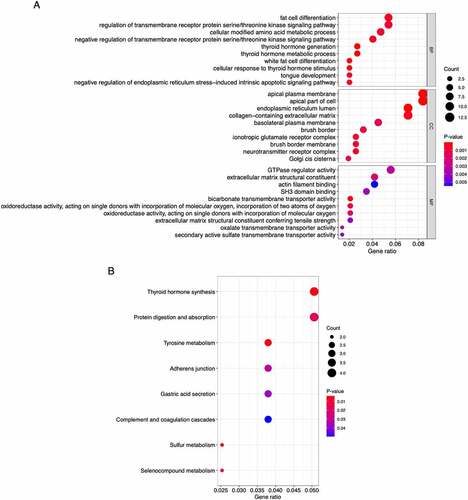
Figure 5. Visualization of the protein–protein interaction (PPI) network and top 10 hub genes. (a) PPI network of the 162 overlapping genes. Blue nodes represent the genes; edges represent interactions between nodes. (b) Identification of hub genes from the PPI network using the Maximal Clique Centrality (MCC) algorithm. The edges represent protein–protein associations. Red nodes represent genes with high MCC sores; yellow nodes represent genes with low MCC scores
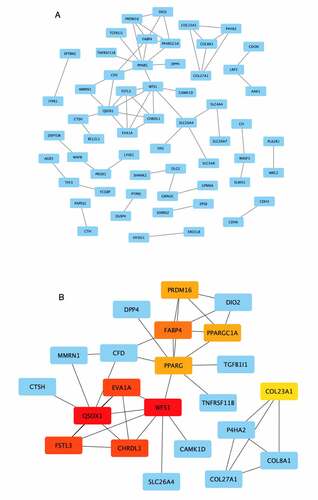
Figure 6. Survival analysis of the top 10 hub genes in patients with thyroid carcinoma (THCA). (a) Overall survival (OS) analysis for EVA1A in THCA using the R package survival. (b, c) Disease-free survival (DFS) analysis for CHRDL1 (b) and FABP4 (c) in THCA using the GEPIA2 tool. The patients were classified into high-level (red) and low-level (green) groups according to the median expression levels of the genes. P < 0.05 was considered to be a statistically significant difference
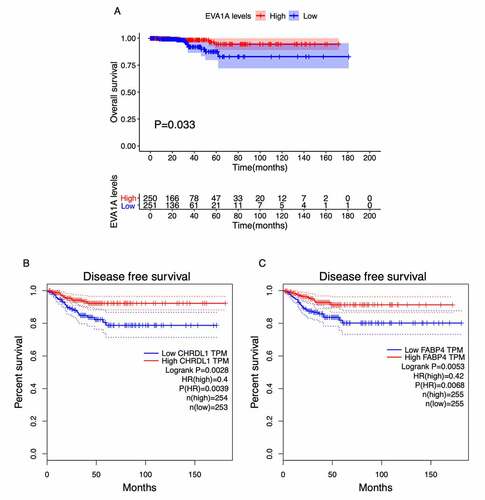
Figure 7. Immunohistochemical images of prognosis-related genes in cancer and normal tissues from the HPA database. (a, b) Abundance levels of EVA1A in (a) thyroid carcinoma (THCA) tissues (Antibody HPA008055; Staining: Not detected; Intensity: Negative; Quantity: None) and (b) normal thyroid tissues (Antibody HPA008055; Staining: Low; Intensity: Week; Quantity: 75%–25%). (c, d) Abundance levels of CHRDL1 in (c) THCA tissues (Antibody HPA000250; Staining: Not detected; Intensity: Negative; Quantity: None) and (d) normal thyroid tissues (Antibody HPA000250; Staining: Low; Intensity: Week; Quantity: 75%–25%)
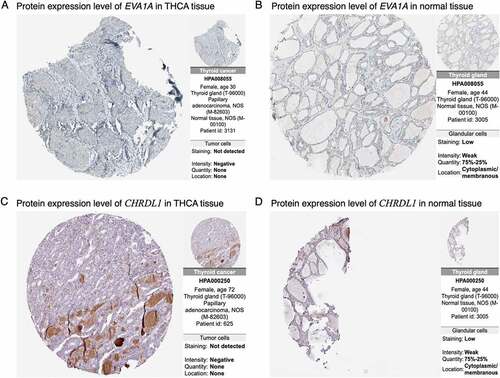
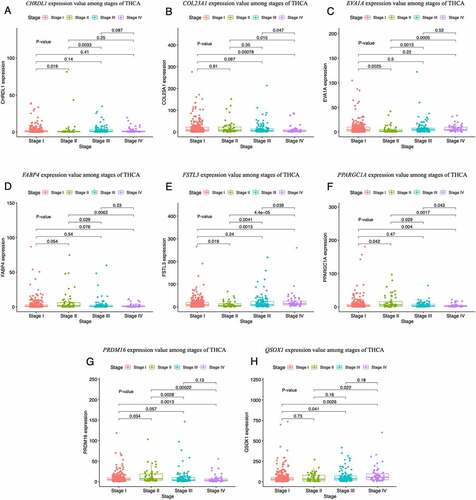
Figure 8. Boxplots of the hub gene expression levels in thyroid carcinoma (THCA) tissues at different clinical stages. (a–h) Expression levels of CHRDL1 (a), COL23A1 (b), EVA1A (c), FABP4 (d), FSTL3 (e), PPARGC1A (f), PRDM16 (g), and QSOX1 (h) at different stages of THCA. P-values represent the differences in gene expression levels between the clinical stages. P < 0.05 was considered to be a statistically significant difference