Figures & data
Figure 1. Effects of resveratrol (Res) on malignant phenotype of OSCC cells. Treated cells were assayed for (a) viability, (b) apoptosis, (c) colony-forming ability, and (d) proliferation based on BrdU incorporation. *P< 0.05 vs. Res 0 μM control
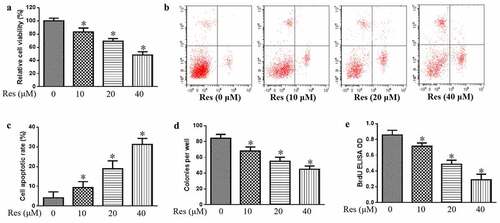
Figure 2. Effects of resveratrol (Res) on cell invasion and the expressions of cell adhesion and migration molecules ITGA5, ITGB1, and CD44. After treatment with 0, 10, 20, and 40 μM resveratrol for 48 h, (a) the number of invading CAL-27 cells was determined by the Matrigel invasion assay; (b) the relative expression levels of ITGA5, ITGB1, and CD44 mRNA were measured by qRT-PCR; the relative expression levels of ITGA5, ITGB1, and CD44 were determined using (c) Western blotting and (d) quantitation. *P< 0.05 vs. Res 0 μM control
Figure 3. Effects of resveratrol (Res) on expression of genes associated with vascular normalization and metastasis: (a) angiogenin and VEGF, (b) PHD2 and RGS5, (c) PDGFB and CD105, and (d) E-cadherin and MMP3. *P< 0.05 vs. Res 0 μM control
Figure 4. Effects of resveratrol (Res) on ZNF750 and RAC1 expressions. After treatment with 0, 10, 20, and 40 μM resveratrol for 48 h, ZNF750 and RAC1 expressions were determined using (a) Western blotting and (b) quantitation. After transfecting with ZNF750 mimics or inhibitor, the expression levels of ZNF750 were determined using (c) Western blotting and (d) quantitation. *P< 0.05 vs. Res 0 μM control
Figure 5. ZNF750 over- or underexpression altered the inhibitory effect of resveratrol (Res) on the growth of OSCC cells. After transfection with ZNF750 mimic or inhibitor for 4 h, CAL-27 cells were treated with 20 μM resveratrol for 48 h, RAC1 expression was determined using (a) Western blotting and (b) quantitation. (c) Cell viability and (d) cell apoptosis were measured using CCK-8 assay and Annexin V-FITC staining, respectively. *P< 0.05, compared to control mimic; #P< 0.05 compared to the resveratrol group
Figure 6. Resveratrol inhibited the growth of CAL-27 cells via suppressing RAC1 expression. After treatment with NSC23766 (2 μM) or DAM (2 μM) for 4 h, and then incubation with 20 μΜ resveratrol for 48 h, the cell viability (a and c) and apoptosis (b and d) were measured using CCK-8 assay and Annexin V-FITC staining, respectively. *P< 0.05, compared to control mimic; #P< 0.05 compared to the resveratrol group