Figures & data
Figure 1. The expression of LncRNA DDX11-AS1 was significantly increased in ESCA tissues and cell lines. A. Analyze the expression difference of lncRNA in ESCA tissue and normal tissue adjacent to the cancer by RNA-seq data in the TCGA database. B. Analyze the expression difference of lnc RNA DDX11-AS1 in ESCA tissues and normal tissues adjacent to cancer by GEPIA database. C. The expression levels of lnc RNA DDX11-AS1 in 76 pairs of ESCA tissues and adjacent normal tissues were detected by RT-qPCR. D. The expression levels of lnc RNA DDX11-AS1 in ESCA tissues and adjacent normal tissues were evaluated by fluorescence in situ hybridization. Scare bare: 50 μm. E. The expression level of lnc RNA DDX11-AS1 in ESCA cell lines EC9706, ECA109, KYSE30 and normal human esophageal epithelial cells (SHEE) was as KM-plotter assessed by RT-qPCR. F. survival curve of patients with ESCA in lnc RNA DDX11-AS1 high or low expression groups was made by KM-plotter survival analysis. Three independent assays were performed in triplicate in E. *, P < 0.05, **, P < 0.01, and ***, P < 0.001. The error bars are defined as s.d
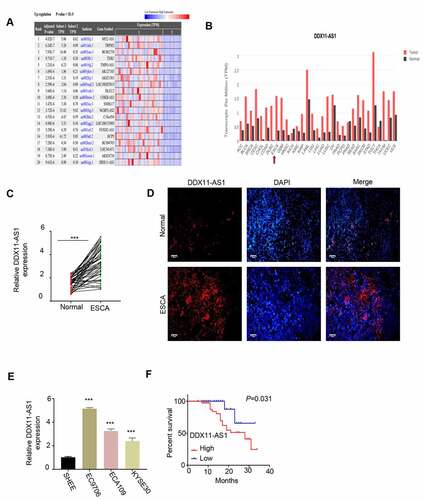
Figure 2. Low expression of lncRNA DDX11-AS1 reduced the proliferation, migration and invasion of ESCA cells, and enhanced apoptosis. A. The silencing efficiency of lnc RNA DDX11-AS1 was detected by RT-qPCR. B. The absorbance values of EC9706 and ECA109 cells with lnc RNA DDX11-AS1 knockdown and their control cells at 0 h, 24 h, 48 h, 72 h and 96 h were detected by CCK-8. C. The effect of lnc RNA DDX11-AS1 on the cell cycle was detected by fluorescence activated flow cytometry. D. The colony formation ability of EC9706 and ECA109 cells with lnc RNA DDX11-AS1 knockdown and their control cells were tested by colony formation assays. E, F. The migration and invasion abilities of EC9706 and ECA109 cells with lnc RNA DDX11-AS1 knockdown and their control cells were assessed by Transwell assay. G. The apoptotic status of EC9706 and ECA109 cells with lnc RNA DDX11-AS1 knockdown and their control cells was evaluated by flow cytometry. Three independent assays were performed in triplicate in the above data. *, P < 0.05, **, P < 0.01, and ***, P < 0.001. The error bars are defined as s.d
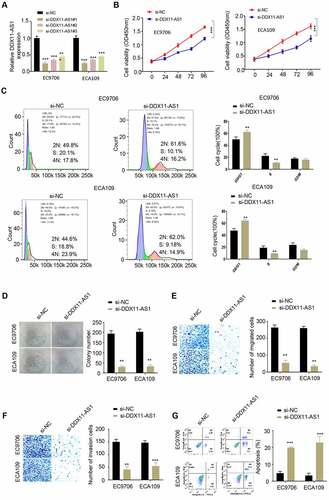
Figure 3. LncRNA DDX11-AS1 competitively inhibits the expression of miR-514b-3p. A. The potential binding sites of miR-514b-3p in lnc RNA DDX11-AS1 3ʹUTR region were analyzed by Starbase 2.0 database (http://starbase.sysu.edu.cn/). B. The expression of miR-514b-3p in ESCA cell lines EC9706 and ECA109 and normal human esophageal epithelial cells SHEE was detected by RT-qPCR. C. The binding of miR-514b-3p and lnc RNA DDX11-AS1 in EC9706 and ECA109 cells was assessed by the luciferase reporter gene assay. D. The expression of lnc RNA DDX11-AS1 after miR-514b-3p overexpression or silencing was evaluated in EC9706 and ECA109 cells by RT-qPCR. E. The expression of miR-514b-3p in 76 ESCA tissues and adjacent normal tissues was detected by RT-qPCR. F. The correlation between the expression of lnc RNA DDX11-AS1 and miR-514b-3p in 76 ESCA tissues was evaluated by Spearman’s correlation coefficient analysis. Three independent assays were performed in triplicate in A-E. *, P < 0.05, **, P < 0.01, and ***, P < 0.001. The error bars are defined as s.d
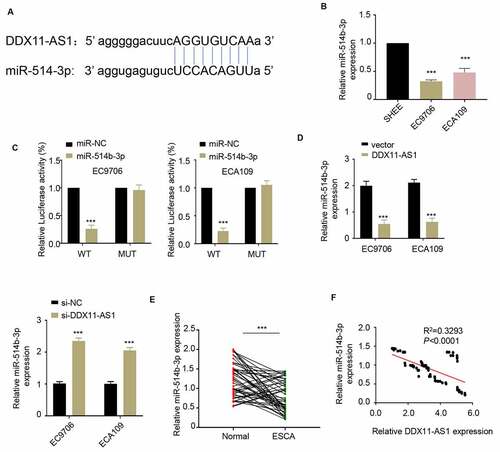
Figure 4. MiR-514b-3p binds to RBX1 mRNA and inhibits its expression in ESCA cells. A. The binding of miR-514b-3p and RBX1 3ʹ – UTR was predicted by TargetScan software (http://www.targetscan.org/vert_72/). B. The expression of RBX1 in ESCA cell lines EC9706, ECA109 and normal human esophageal epithelial cells SHEE was assessed by RT-qPCR. C. The binding of miR-514b-3p to RBX1 3ʹ-UTR in EC9706 and ECA109 cells was detected by the luciferase reporter gene assay. D, E. The expression of RBX1 mRNA and protein was assessed by RT-qPCR (d) and western blot (e) after overexpression or silencing of miR-514b-3p in EC9706 and ECA109 cells. F. The correlation between the expression of RBX1 and lnc RNA DDX11-AS1 or miR-514b-3p in ESCA tissues was evaluated by Spearman correlation coefficient analysis. Three independent assays were performed in triplicate in B-E. *, P < 0.05, **, P < 0.01, and ***, P < 0.001. The error bars are defined as s.d
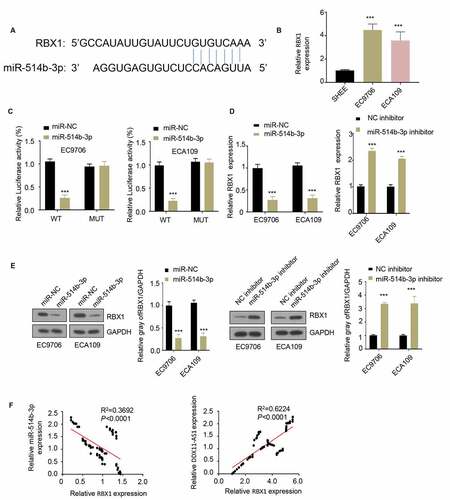
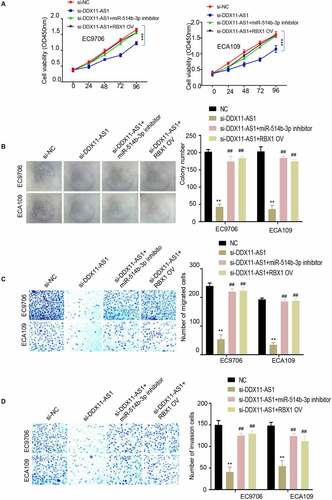
Figure 5. MiR-514b-3p overexpression or RBX1 knockdown reversed the ability of lncRNA DDX11-AS1 to promote the aggressive phenotypes of ESCA cells. A. The proliferation ability of EC9706 and ECA109 cells with indicated treatment was detected by CCK-8. B. The colony formation ability of EC9706 and ECA109 cells with indicated treatment was tested by the colony formation assay. C. The migration and invasion ability of EC9706 and ECA109 cells with indicated treatment was evaluated by Transwell (without Matrigel for migration and with Matrigel for invasion). Three independent assays were performed in triplicate in the above data. *, P < 0.05, **, P < 0.01, and ***, P < 0.001. The error bars are defined as s.d