
Figures & data
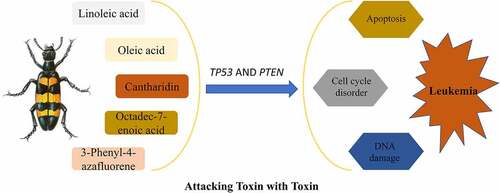
Table 1. The effective components of Mylabris screened using TCMSP database
Figure 1. Interaction diagram between active ingredients and potential targets
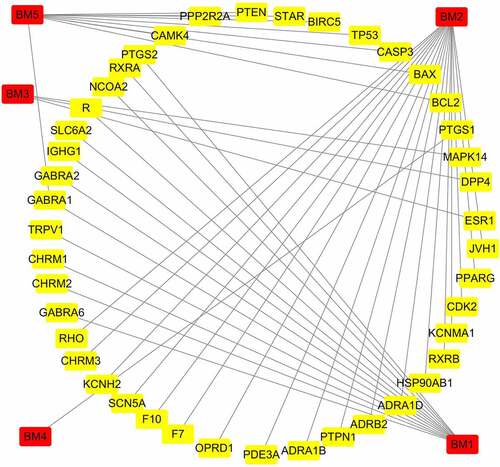
Figure 2. Intersection of mylabris target genes and leukemia disease genes
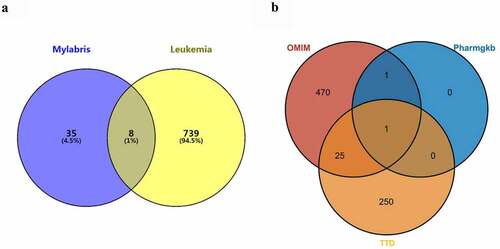
Figure 3. PPI network interaction among intersection targets
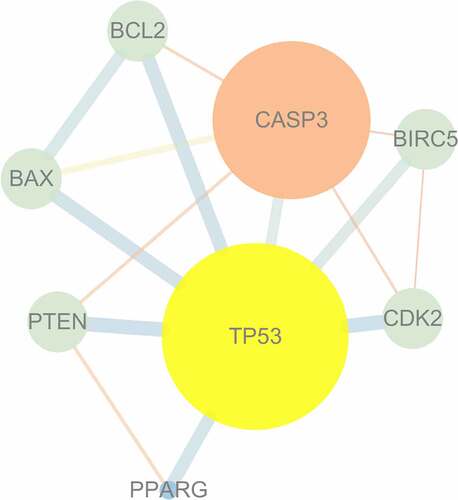
Figure 4. GO enrichment analysis of 8 potential targets
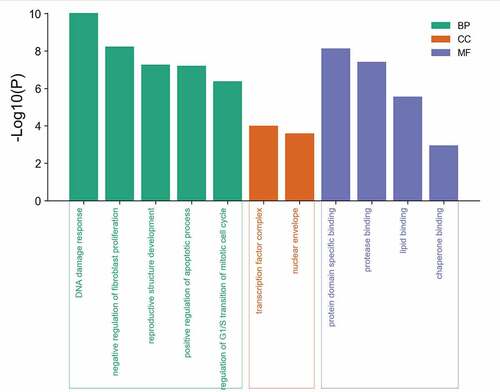
Figure 5. KEGG pathway enrichment analysis of potential acting genes
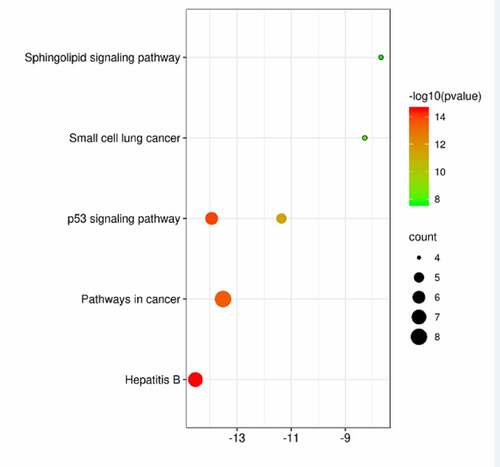
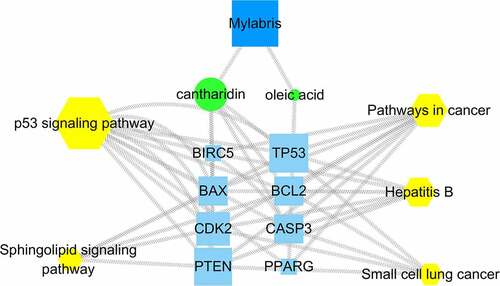
Figure 6. Active ingredient-target-path diagram
Data availability statement
All of the datasets analyzed were acquired from the traditional Chinese medicine system pharmacology (TCMSP) database (https://tcmspw.com/tcmsp.php), Online Mendelian Inheritance in Man (OMIM) database (http://www.omim.org/), Therapeutic Target Database (TTD) database (http://www.db.idrblab.net/ttd/), PharmGKB database (https://www.pharmgkb.org/) and GeneCards database (https://www.genecards.org).