Figures & data
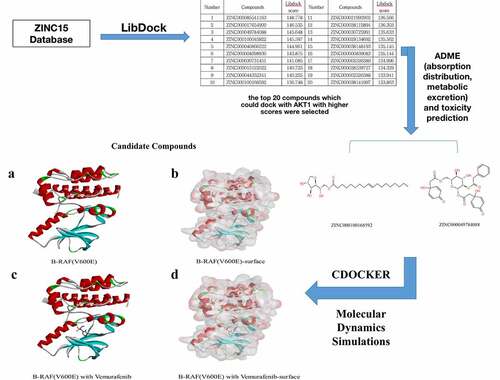
Figure 1. Molecular structure of B-RAF(V600E). (a) Initial molecular structure. (b) Surface of binding area added. Blue represents positive charge, and red represents negative charge. (c) Vemurafenib of binding area added
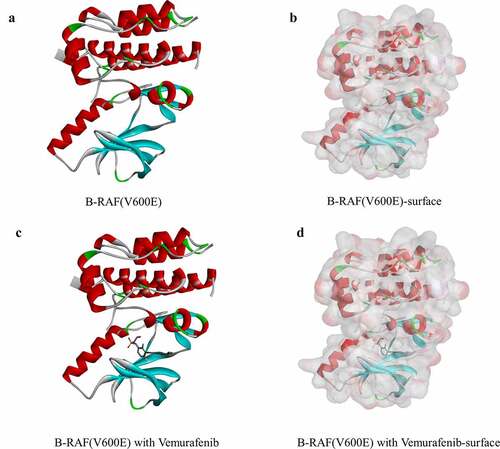
Table 1. Top 20 ranked compounds with higher libdock scores than Vemurafenib
Table 2. ADME (Adsorption, Distribution, Metabolism, Excretion) properties of compounds
Table 3. Toxicities of compounds
Figure 2. Structures of Vemurafenib and novel compounds selected from virtual screening
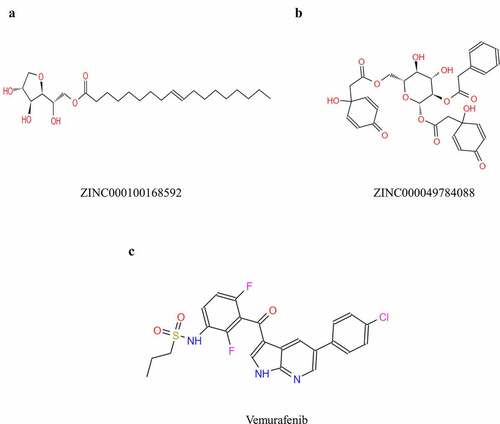
Table 4. CDOCKER interaction energy of compounds with mTORC1
Table 5. Hydrogen bond interaction parameters for each compound and BRAF(V600E residues
Table 6. π-π interaction, π-Alkyl interaction, Alkyl interaction, π-cation interaction and Unfavorable Doner-Doner interaction, parameters for each compound and mTORC1 residues
Figure 3. Schematic of intermolecular interaction of the predicted binding modes of (a) ZINC000100168592 with B-RAF(V600E), (b) ZINC000049784088 with B-RAF(V600E), and (c) Vemurafenib with B-RAF(V600E)
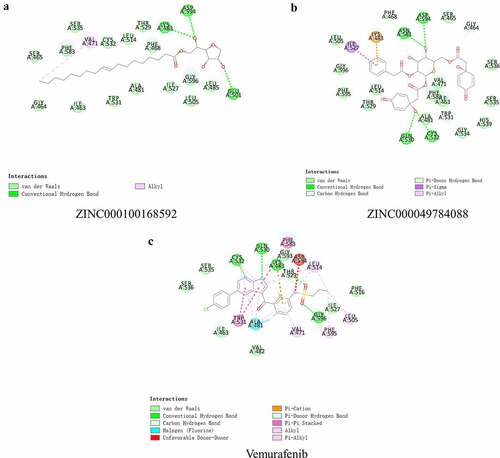
Figure 4. Schematic drawing of interactions between ligands and B-RAF(V600E). The surface of binding areas was added. Blue represents positive charge; red represents negative charge; and ligands are shown in sticks, with the structure around the ligand-receptor junction shown in thinner sticks. (a) ZINC000100168592-B-RAF(V600E) complex. (b) ZINC000049784088-B-RAF(V600E) complex
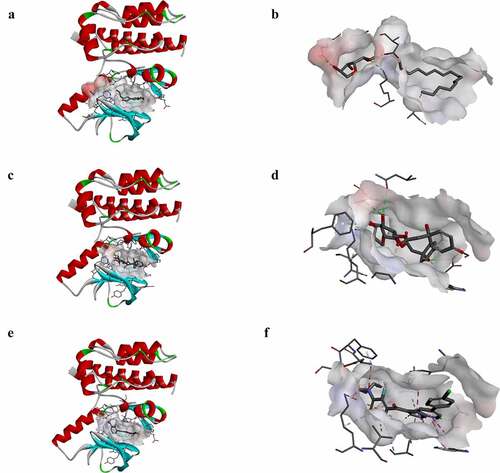
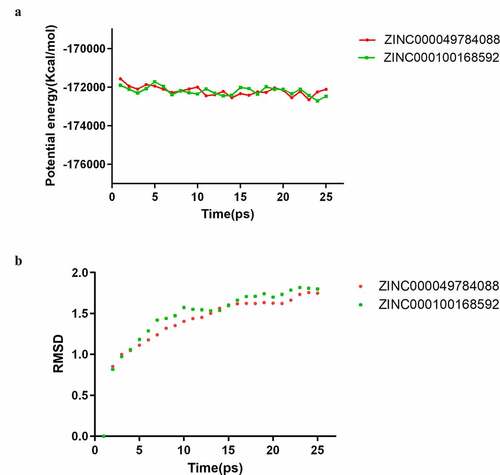
Figure 5. Results of molecular dynamics simulation of the compounds ZINC000100168592 and ZINC000049784088. (a) Potential energy, Average backbone root-mean-square deviation. (b) RMSD, root-mean-square deviation