
Figures & data
Figure 1. Human blood EVs confirmation. EVs were isolated and purified from plasma using membrane affinity spin columns. (a) Electron microscopy image of isolated vesicles. (b) Size distribution measurements of isolated vesicles. (c) Western blots of calnexin, which can be detected in PBMCs, but not in isolated vesicles, was used as a control. EV markers TSG101 and CD63 in isolated vesicles were detected in EVs, but not in PBMCs
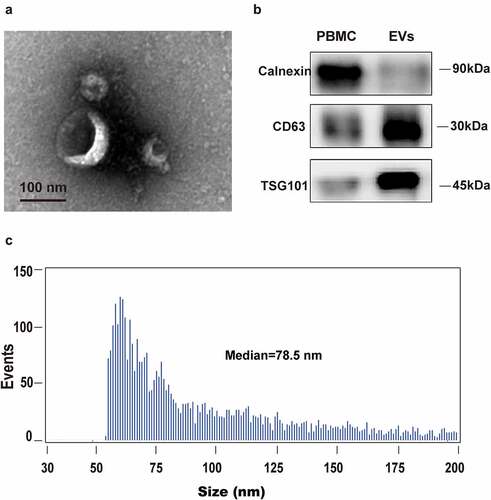
Figure 2. Comprehensive mRNAs in extracellular vesicles and functional annotations before and after surgery. (a-c) Significant DEGs in extracellular vesicles were screened and identified using the ‘Limma’ R package between samples before surgery and after extubation (Fig. A), or 1 day after surgery (Fig. B), or 3 days after surgery (Fig. C). (d) A total of 11 common DEGs were obtained in extracellular vesicles before and different time points after surgery using a Venn diagram
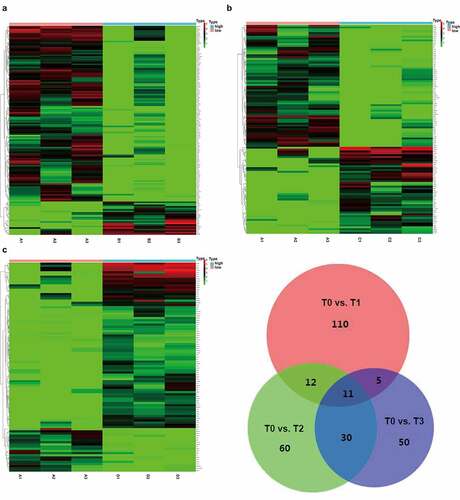
Figure 3. The functional annotations of mRNAs in EVs. (a) Biological processes, cellular components, and molecular function analysis from GO items of 11 hub genes were evaluated. (b) The protein–protein interaction network was used, showing direct interactions and potential associations between proteins. (c) The 11 hub genes most significantly involved in changed GO functions. (d) Significantly altered KEGG and Reactome pathways were predicted
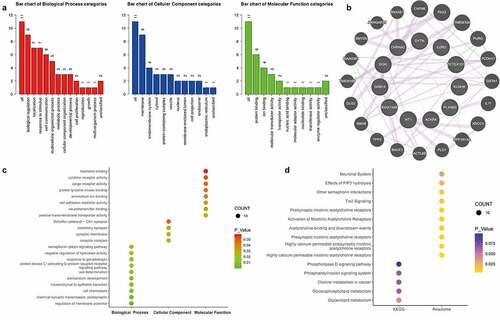
Figure 4. Comprehensive lncRNAs in EVs before and after surgery. (a-c) Significant lncRNAs in EVs were also screened and identified using the ‘Limma’ R package between samples before surgery and after extubation (Fig. A), or 1 day after surgery (Fig. B), or 3 days after surgery (Fig. C). (d) A total of 3 common DEGs were obtained in EVs before and different time points after surgery using a Venn diagram
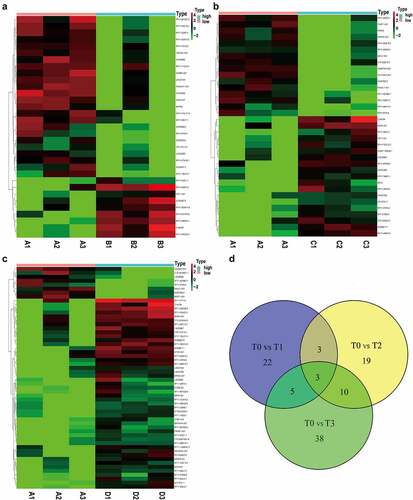
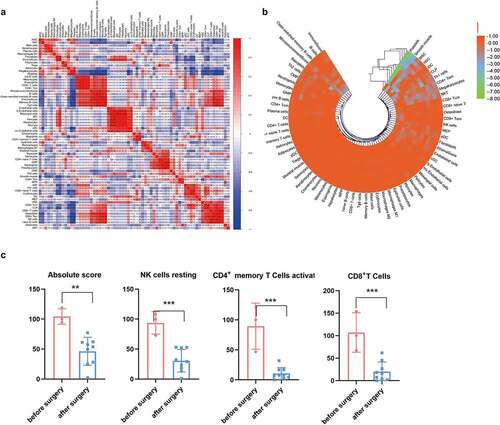
Figure 5. Cell source analysis of EVs. (a) The correlation of immune and stroma cell expression derived from EVs. (b) Dynamic changes of cells derived from EVs before and after surgery. (c) Comparison of immune cells producing EVs before and after surgery. * p < 0.05, ** p < 0.01, *** p < 0.01 vs before surgery
Significant DELRs between T0 and T1
Significant DELRs between T0 and T2
Significant DEGs between T0 and T1
Significant DEGs between T0 and T2
Significant DEGs between T0 and T3