
Figures & data
Figure 1. Identification of isolated chondrocytes and determination of optimal concentrations of drugs. (a). Collagen II expression was detected using an immunofluorescence assay. The expression level of collagen II was decreased in chondrocytes isolated from OA rats. (b). Viability of treated chondrocytes was measured using the CCK-8 assay. The highest concentration at which rapamycin, 3-methyladenine, and icariin were incubated with chondrocytes was 100 nM, 12 mM, and 80 μM, respectively (*p < 0.05, **p < 0.01). Data are presented as means ± SD (n = 6)
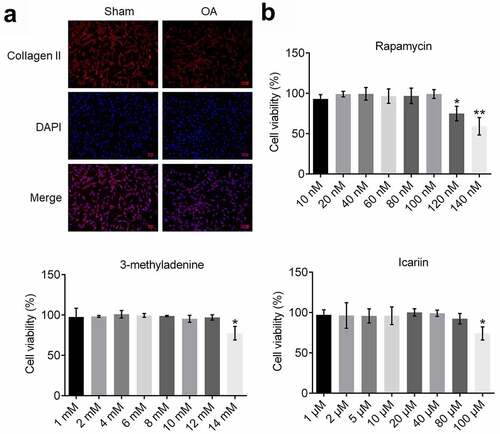
Figure 2. Apoptosis in OA chondrocytes was significantly alleviated by icariin. (a). AO-PI staining was used to evaluate the apoptotic state of treated chondrocytes. Fluorescence intensity was decreased in the rapamycin and icariin groups and increased in the 3-methyladenine group. (b). Flow cytometry was used to determine the apoptotic rate of treated chondrocytes. Apoptotic rate was decreased in the rapamycin and icariin groups and increased in the 3-methyladenine group
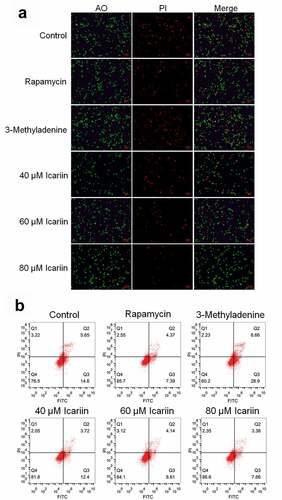
Figure 3. Autophagy in OA chondrocytes was activated by icariin. (a). Gene expression of Atg7 and LC3 was detected using qRT-PCR. Atg7 and LC3 expression was downregulated in the 3-methyladenine group and upregulated in the rapamycin and icariin groups (*p < 0.05 and **p < 0.01 vs. Control). (b). ATG7 and LC3-II/LC3-I protein levels were measured using western blotting. ATG7 and LC3-II/LC3-I levels were downregulated in the 3-methyladenine group and upregulated in the rapamycin and icariin groups (*p < 0.05 and **p < 0.01 vs. Control). Data are presented as means ± SD (n = 6)
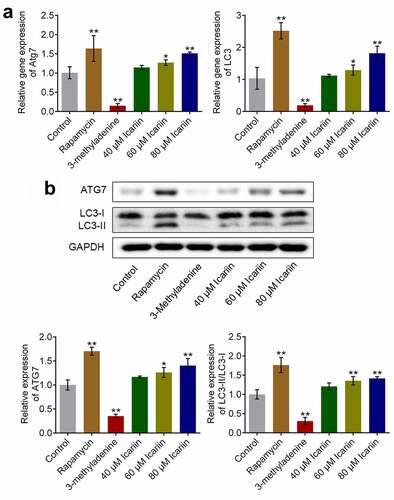
Figure 4. PI3K/AKT/mTOR signaling was drastically suppressed by icariin. Western blotting was used to determine the protein levels of PI3K, p-AKT1, AKT1, p-mTOR, mTOR, p70S6K, and p-p70S6K in treated chondrocytes. PI3K, p-AKT1/AKT1, p-mTOR/mTOR, and p70S6K/p-p70S6K levels were significantly decreased in the rapamycin and icariin groups and increased in the 3-methyladenine group (**p < 0.01 vs. Control). Data are presented as means ± SD (n = 6)
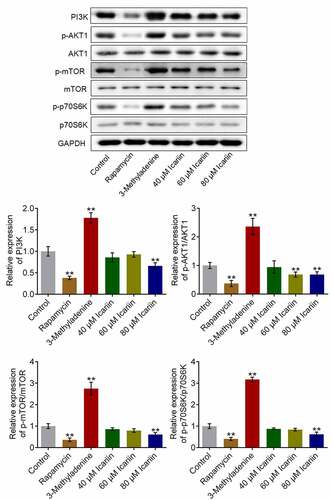
Figure 5. Icariin markedly ameliorated the pathological state of cartilage tissues in OA rats. (a). Pathological changes of articular cartilage were visualized using micro-CT scanning. The rough surface, focal plane cracks, exposed subchondral bone, oval osteophytes in articular cartilage and thin cartilage layer, disordered arrangement of bone trabeculae, and cystic subchondral bone on articular head were significantly alleviated in the rapamycin and icariin groups. (b). Pathological state of cartilage tissues was evaluated using safranin O staining. Cartilage degeneration and loss of proteoglycan, surface layer, and fiber layer in OA rats were notably ameliorated in the rapamycin and icariin groups
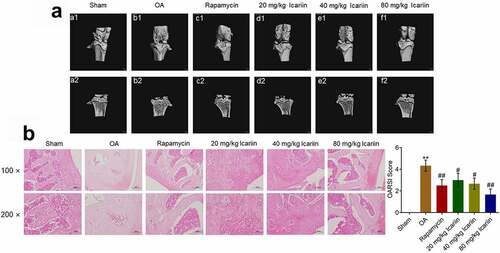
Figure 6. Icariin activated autophagy in OA chondrocytes. (a). Beclin-1 expression level was measured using an immunohistochemical assay. Beclin-1 was upregulated in the rapamycin and icariin groups. (b). LC3 expression was visualized using an immunofluorescence assay. LC3 was upregulated in the rapamycin and icariin groups. (c). Western blotting was used to assess the expression of ATG7, LC3-I, and LC3-II in cartilage tissues. ATG7 and LC3-II/LC3-I levels were elevated in the rapamycin and icariin groups (**p < 0.01 vs. Sham, ##p < 0.01 vs. OA). Data are presented as means ± SD (n = 6)
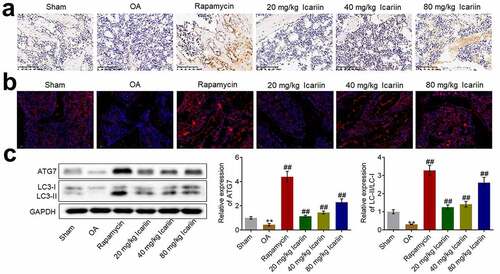
Figure 7. Icariin potently suppressed PI3K/AKT/mTOR signaling in cartilage tissues. Western blotting was used to measure the protein levels of PI3K, p-AKT1, AKT1, p-mTOR, mTOR, p70S6K, and p-p70S6K in cartilage tissues. PI3K, p-AKT1/AKT1, p-mTOR/mTOR, and p70S6K/p-p70S6K levels were significantly suppressed in the rapamycin and icariin groups (**p < 0.01 vs. Sham, ##p < 0.01 vs. OA). Data are presented as means ± SD (n = 6)
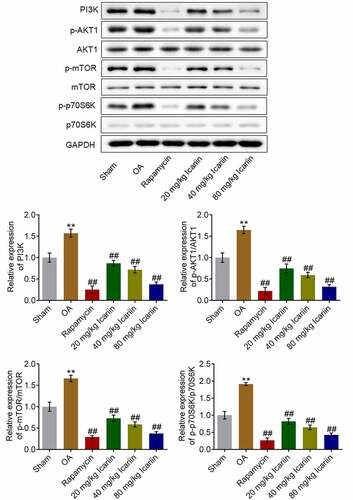
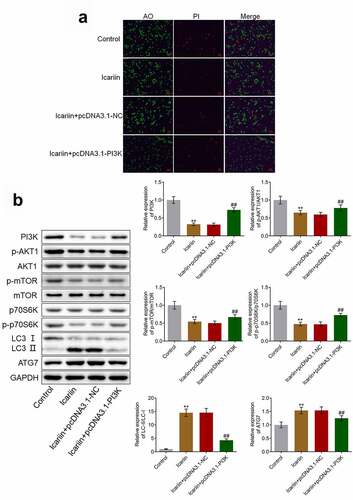
Figure 8. PI3K overexpression abolished the protective effect and autophagy-promoting effect of icariin on OA chondrocytes. (a). AO-PI staining was used to evaluate the apoptotic state of treated chondrocytes. The proportion of apoptotic chondrocytes was decreased following icariin treatment, but the effect was reversed by the overexpression of PI3K. (b). Western blotting was used to determine the protein levels of PI3K, p-AKT1, AKT1, p-mTOR, mTOR, p70S6K, p-p70S6K, LC3, and ATG7. PI3K, p-AKT1, p-mTOR, and p-p70S6K levels were significantly decreased and LC3-II/LC3-I and ATG7 levels were drastically increased in the icariin group, but these effects were reversed by PI3K overexpression (**p < 0.01 vs. Control, ##p < 0.01 vs. icariin + pcDNA3.1-NC)
Data availability statements
Part of the data can be shared if it is requested from the editor.