
Figures & data
Figure 1. Sample tree clustering and clinical trait heatmap of 70 primary and 47 recurrent glioblastoma multiforme (GBM) samples. For sample tree clustering, there were no samples with height > 300, and all samples were used for the weighted gene co-expression network analysis (WGCNA). For the construction of the clinical trait heatmap, the recurrence state contained two parts classified as with or without recurrence (with recurrence is shown in red, and without recurrence is shown in white); recurrence time contained three parts classified as non-recurrence, recurrence once, and recurrence twice (non-recurrence is shown in white, recurrence once is shown in pink, and recurrence twice is shown in red). The clinical trait heatmap shows the information of all the traits. All the traits could be used for WGCNA
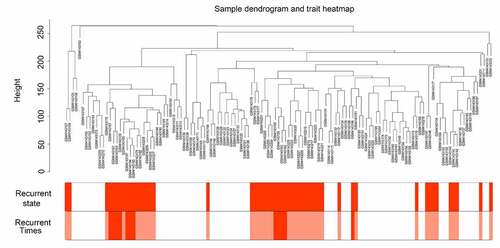
Figure 2. WGCNA for the gene expression profiles of 117 GBM tissues. (a-b) Scale independence and mean connectivity of various soft-threshold values (β). Red numbers indicate the different soft threshold values (1–20), while the red lines indicate the selected cutoff values, as the scale independence > 0.85. (c) Gene sets with the corresponding log10 and log10 P-values when the scale-free topology is set as β = 10. (d) Clustering dendrograms of all genes with dissimilarities based on topological overlap, together with their assigned module colors
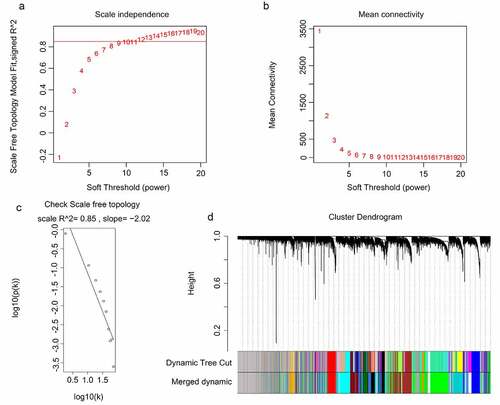
Figure 3. Identification of significant modules associated with the clinical traits (recurrence state and recurrence time). Each cell in the heat map contains the corresponding correlation score and P-value between gene modules and clinical traits. Red indicates positive correlation, and green indicates negative correlation
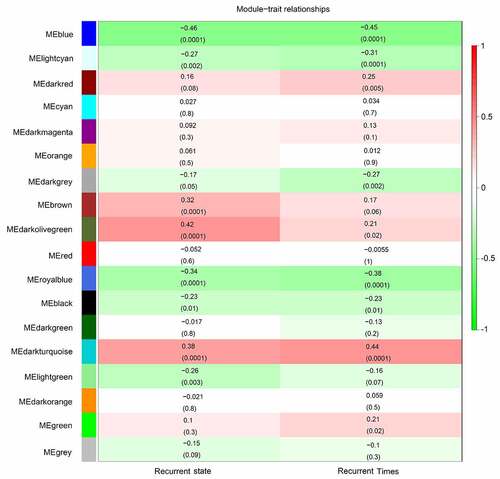
Figure 4. Relationship between gene significance (GS) and module membership (MM) in the significant modules. (a) Relationship between the MM in blue and GS for recurrence state; (b) Relationship between the MM in blue and GS for recurrence time; (c) Relationship between MM in royal blue and GS for recurrence state; (d) Relationship between the MM in royal blue and GS for recurrence time; (e) Relationship between the MM in dark turquoise and GS for recurrence state; (f) Relationship between the MM in dark turquoise and GS for recurrence time
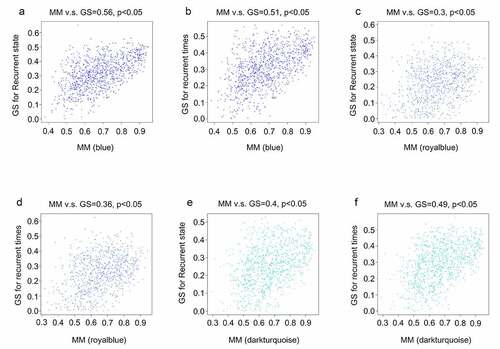
Figure 5. Gene set enrichment analysis (GSEA) for the enriched biological terms of differentially expressed genes between 70 primary and 47 recurrent GBM tissues
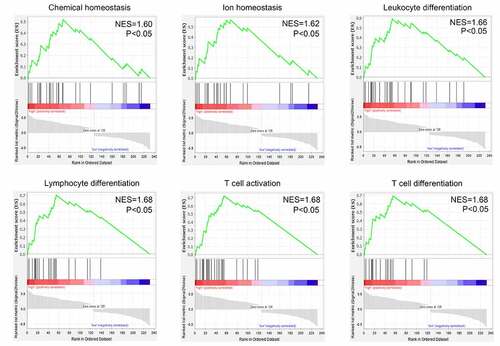
Figure 6. Intersection analysis for the genes in significant modules and differentially expressed genes. (a) Intersection analysis for the genes in significant modules positively associated with recurrence and upregulated genes in recurrent GBM tissues; (b) Intersection analysis for the genes in significant modules negatively associated with recurrence and downregulated genes in recurrent GBM tissues
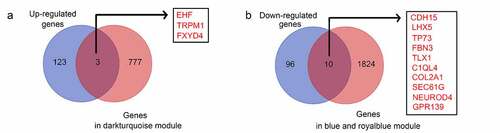
Figure 7. Kaplan–Meier survival analysis of the relationship between the expression of hub genes and the survival of GBM patients according to the data from the Chinese Glioma Genome Atlas (CGGA). The two red imaginary lines indicate 95% confidence interval (CI) for the high expression group, while the two blue imaginary lines indicate 95% CI for the low expression group
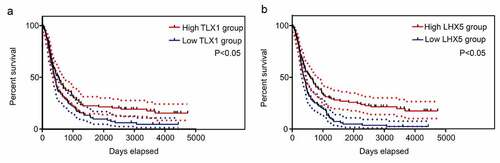
Figure 8. Pearson correlation analysis showed the expression levels of LIM homeobox 5 (LHX5) and T cell leukemia homeobox 1 (TLX1) were weakly and positively associated with the Karnofsky performance scale (KPS) scores
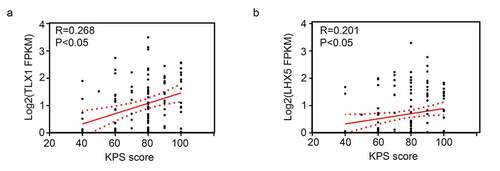
Table 1. Detail scores of T cell leukemia homeobox 1 (TLX1) and LIM homeobox 5 (LHX5) expression in the primary and recurrent glioblastoma multiforme (GBM) tissues
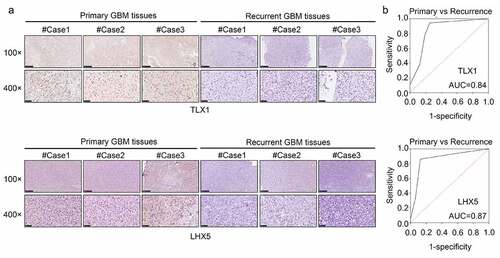
Figure 9. LIM homeobox 5 (LHX5) and T cell leukemia homeobox 1 (TLX1) were downregulated in the recurrent GBM tissues and exhibited high diagnostic value. (a) Immunohistochemical (IHC) staining was used to determine the expression of LHX5 and TLX1 in the recurrent GBM tissues and primary GBM tissues. (b) Receiver operating characteristic (ROC) analysis was performed to determine the diagnostic value of LHX5 and TLX1 in distinguishing between the recurrent and primary GBM tissues
Supplemental Material
Download ()Data availability statement
The datasets used and/or analyzed in the current study are available from the corresponding author upon reasonable request.
GEO database (https://www.ncbi.nlm.nih.gov/gds)
GSEA (https://software.broad institute. org/gsea/index.jsp)
CCGA (http://www.cgga.org.cn/)