Figures & data
Figure 1. DSS repressed the proliferation and migration of NIH3T3 cells induced by TGF-β1. NIH3T3 cells were treated with TGF-β1 (5 ng/mL) in the absence or presence of DSS for 24 h. (a) The effect of DSS (25, 50, 100, 200 and 400 μM) on the cell viability was detected by CCK-8 assay. (b) The effect of DSS (25, 50, 100, 200 and 400 μM) on the cell viability induced by TGF-β1 was detected by CCK-8 assay. (c) Effects of DSS (50 μM) on the cell migration were detected by wound healing analysis. Scale bar: 200 μm. (d) The calculation of wound healing ratio. (e, f) The expression of PCNA was detected by western blot assay. GAPDH was conducted as a loading control. One-way ANOVA, *p < 0.05, **p < 0.01, ***p < 0.001, ****p < 0.0001, ns: non-significant
Figure 2. DSS inhibited TGF-β1-induced fibroblast-myofibroblast differentiation via inhibiting the MEK/ERK signaling pathway in NIH3T3 cells. (a) Immunofluorescence was conducted to evaluate the expression of α-SMA (red). Nucleus was stained with DAPI (blue). Scale bar: 50 μm. (b) Relative mRNA expression of Col1a1 and α-SMA. (c, d) Expressions of p-MEK1/2, MEK1/2, p-ERK1/2, ERK1/2 were detected by western blot. GAPDH was conducted as a loading control. One-way ANOVA, **p < 0.01, ***p < 0.001, ****p < 0.0001
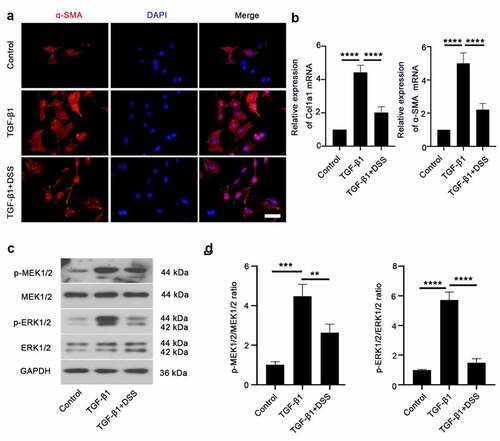
Figure 3. DSS alleviated BLM-induced PF in mice. (a-b) Sections of lung tissue were stained with HE staining and sirius red staining. Scale bar: 100 μm. (c) Histological scores. (d) The pulmonary index was measured. One-way ANOVA, ***p < 0.001, ****p < 0.0001, ns: non-significant
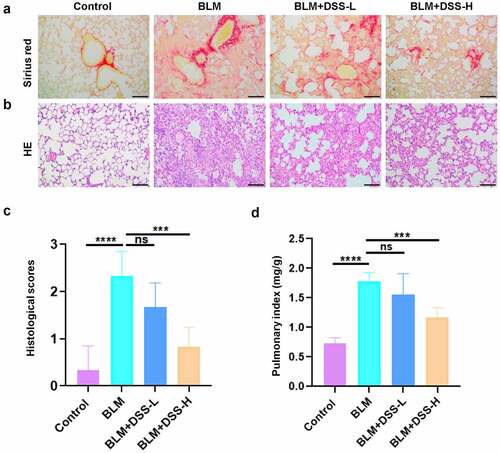
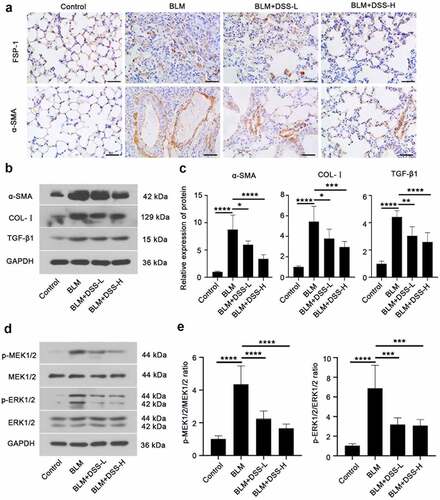
Figure 4. DSS inhibited fibroblast-myofibroblast differentiation via inhibiting the MEK/ERK signaling pathway in BLM-induced mice. (a) Immunohistochemistry analysis of FSP-1 and α-SMA in sections of lung tissues. Scale bar: 50 μm. (b, c) Protein expressions of α-SMA, COL-I, and TGF-β1 were detected by western blot. GAPDH was conducted as a loading control. (d, e) Protein expressions of p-MEK1/2, MEK1/2, p-ERK1/2, ERK1/2 were examined by western blot. GAPDH was conducted as a loading control. One-way ANOVA, *p < 0.05, ***p < 0.001, ****p < 0.0001