Figures & data
Figure 1. Separation of blood cell after secondary centrifugation a. After the first centrifugation, the supernatant and upper 0.1 ml blood cells were collected. b. After the second centrifugation, the lower 0.1 ml supernatant and cells below were collected. c. The middle part full of platelet is called Buffy Coat. What we used were the whole Buffy coat with the least plasma and red blood cell
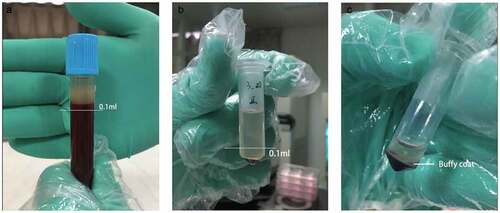
Figure 2. Preparation of rat back skin and different treatments a. After anesthesia, the back skin of the rats was carefully shaved to form an exposure area of 4 cm ×5 cm in size. b. Rule of nines was used to divide the exposed area of back skin for different treatments. Samples (about 10 mm long x 3 mm wide x 2 mm thick) were taken at appropriate time in different groups
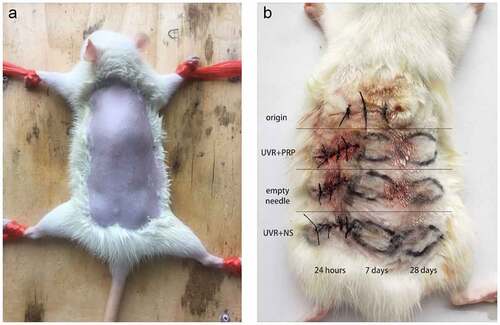
Table 1. The details of RNA primers
Table 2. Changes of platelet count in different rat blood samples before and after the preparation
Figure 3. Rat skin histopathological changes at different points with HE staining (100 fold and 400 fold) a. rat skin histopathological before irradiation. b. 7 days after UVB irradiation in NS treatment group. c. 7 days after UVB irradiation in PRP treatment group. d. 28 days after UVB irradiation in NS treatment group. e. 28 days after UVB irradiation in PRP treatment group
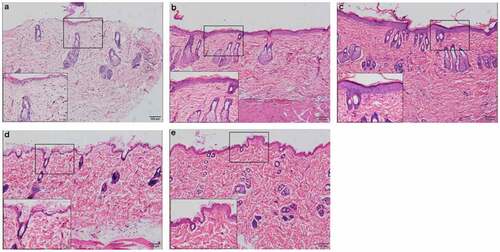
Figure 4. Rat skin histopathological changes of collagen with Masson staining (100 fold) Masson staining was used to observe collagen fibers (blue stained part was collagen fibers) a. Rat skin in NS group on the 28th day. b. Rat skin in PRP group on the 28th day
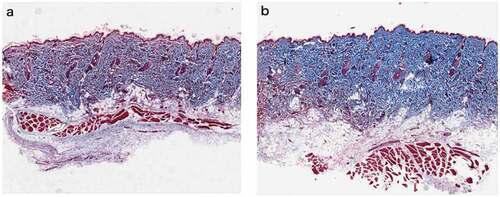
Figure 5. Protein expression changes of Collagen 1a1 and Collagen 3a1 (Western blotting) a. Western analysis of Collagen 1a1 and Collagen 3a1 at different time points of NS and PRP group in rat skin. b. Quantitative protein levels of Collagen 1a1 and Collagen 3a1 expression in the two group at different time points
Figure 6. mRNA expression changes of Collagen 1a1 and Collagen 3a1 (qRT-PCR) a. The expression of Collagen 1a1 and Collagen 3a1 mRNA at different points and statistical analysis between the two groups. *p < 0.05, **p < 0.01 and ***p < 0.001. b. The expression of Collagen 1a1 and Collagen 3a1 mRNA at different points and statistical analysis in PRP group. *p < 0.05, **p < 0.01 and ***p < 0.001 vs. origin group
Figure 7. Changes of ACVR IIA and FST expression in rat skin at 7 and 28 days in NS and PRP treated group. a. Representative images of western blots of ACVR IIA and FST protein in NS and PRP treated group at different time points. b. Quantitative protein levels of ACVR IIA and FST are shown. c. The expression of ACVR IIA and FST mRNA at different points and statistical analysis between groups. *p < 0.05 and ***p < 0.001. d,e. The expression of ACVR IIA and FST mRNA at different points and statistical analysis in groups. *p < 0.05, **p < 0.01 and ***p < 0.001 vs. origin group
Figure 8. Changes of TNF-α, IL-1γ and IL-12b expression in rat skin at 7 and 28 days in NS and PRP treated group. a. Representative images of western blots of TNF-α, IL-1β and IL-12b protein in NS and PRP treated group at different time points. b. Representative images of western blots of TNF-α, IL-1βand IL-12b protein in NS and PRP treated group at different time points. c. The expression of TNF-α, IL-1β and IL-12b mRNA at different points and statistical analysis between groups. *p < 0.05, **p < 0.01 and ***p < 0.001. d,e. The expression of TNF-α,IL-1γ and IL-12b mRNA at different points and statistical analysis in groups. ***p < 0.001 vs. origin group
Figure 9. Changes of Dectin-1, IL-10 and Arg-1 expression in rat skin at 7 and 28 days in NS and PRP treated group. a. Representative images of western blots of Dectin-1, IL-10 and Arg-1 protein in NS and PRP treated group at different time points. b. Quantitative protein levels of Dectin-1, IL-10 and Arg-1 are shown. c. The expression of Dectin-1, IL-10 and Arg-1 mRNA at different points and statistical analysis between groups. **p < 0.01 and ***p < 0.001. d,e. The expression of Dectin-1, IL-10 and Arg-1 mRNA at different points and statistical analysis in groups. *p < 0.05, **p < 0.01 and ***p < 0.001 vs. origin group