Figures & data
Table 1. Clinical characteristic of the glioma patients
Figure 1. Overexpression of REV7 in glioma tissue. (a–b) The expression of REV3L and REV7 in the tumor tissues and adjacent tissues were obtained from the TCGA database. (c) The correlation analysis of REV3 and MAD2L2 was analyzed with TCGA database. (d) The mRNA expression of REV7 was measured by the quantitative reverse transcription polymerase chain reaction analysis. (e–f) The protein expression of REV7 was detected by western blot. * p < 0.05, ** p < 0.01, * p < 0.001. GBM,;T,;N,;TPM,;GAPDH, glyceraldehyde 3-phosphate dehydrogenase
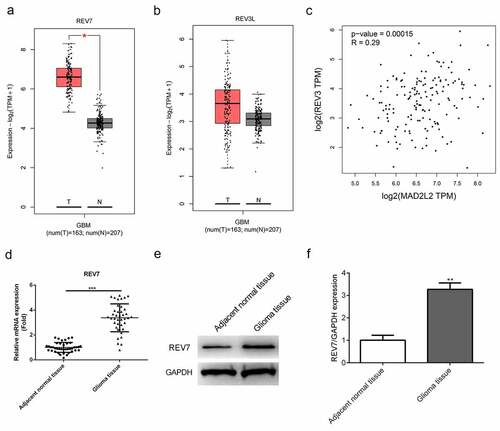
Figure 2. Effect of REV7 siRNA on the proliferation of U251 cells. (a) The mRNA expression of REV7 was measured by the qRT-PCR analysis after REV7 siRNA transfection. (b) The protein expression of REV7 was measured by quantitative reverse transcription polymerase chain reaction (qRT-PCR) analysis after REV7 siRNA transfection. (c) The cell viability was demonstrated by the CCK-8 assay after Cisplatin and REV7 siRNA treatment. (d) The proliferation of the cells was detected by colony formation assay after Cisplatin and REV7 siRNA treatment. ** p < 0.01, * p < 0.001. GAPDH, glyceraldehyde 3-phosphate dehydrogenase; OD, optical density
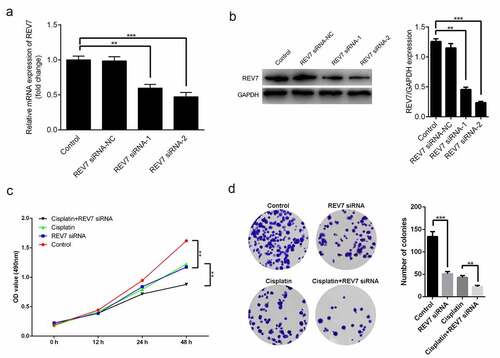
Figure 3. Effect of REV7 siRNA on the apoptosis of U251 cells. (a–b) The apoptosis rate was measured by flow cytometry after Cisplatin and REV7 siRNA treatment. ** p < 0.01. PI,; ANNEXIN-V-F
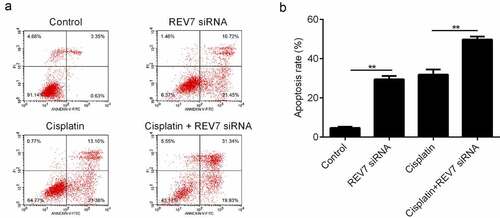
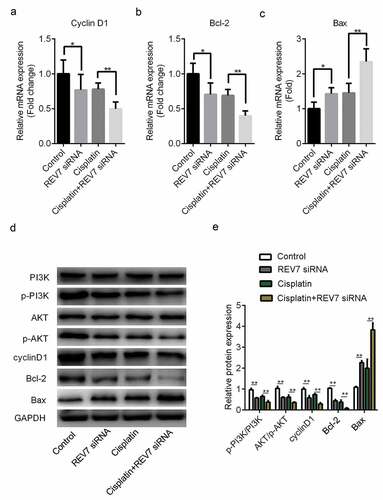
Figure 4. Effect of REV7 siRNA on phosphoinositide 3-kinase (PI3K)/AKT signaling in U251 cells. The mRNA expression levels of cyclin D1 (a), Bcl-2 (b), and Bax (c) were detected by reverse transcription polymerase chain reaction after cisplatin and REV7 siRNA treatment. (d–e) The protein expression levels of cyclin D1, Bcl-2, and Bax PI3K/AKT signaling pathways were detected by western blotting. * p < 0.05, ** p < 0.01. GAPDH, glyceraldehyde 3-phosphate dehydrogenase