
Figures & data
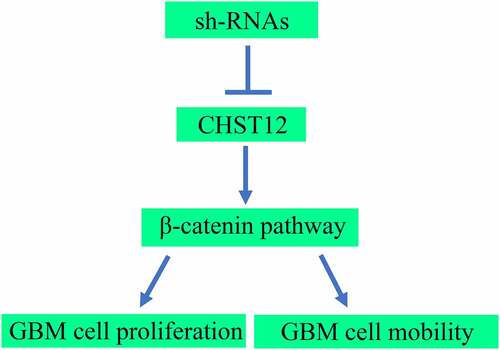
Figure 1. Expression of members of the CHST family in GBM tissues and non-tumor tissues according to the data from TCGA database. Data of 163 GBM tissues were obtained from TCGA database; the upper quartile and lower quartile of expression values in GBM tissues are shown in the red box; data of 207 non-tumor brain tissues were obtained from TCGA and GTEx. The upper quartile and lower quartile of expression values in these tissues are shown in the gray box. *P < 0.05
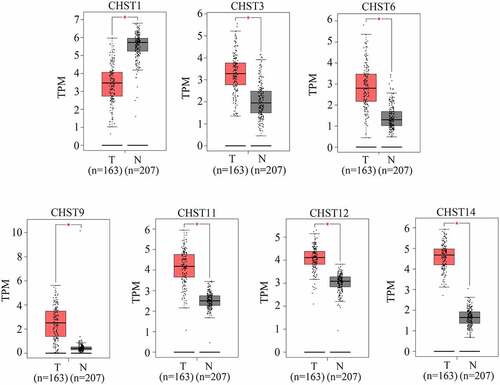
Figure 2. Relationship between the expression of the members of the CHST family and overall survival rate in patients with GBM
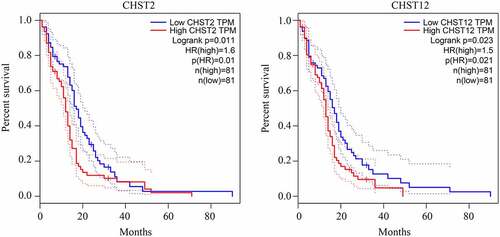
Table 1. Chi-square test for analyzing the relationship between the expression of CHST12 and clinical traits of GBM patients
Table 2. Univariate and multivariate regression analyses for determining the role of CHST12 in GBM
Figure 3. CHST12 was upregulated in GBM tissues. (a) qRT-PCR was used to detect the expression of CHST12 in the adjacent tissues and GBM tissues. (b) Immunohistochemistry was used to detect the expression of CHST12 in the adjacent tissues and GBM tissues. The black lines indicate a measurement of 200 μm. (c) ROC analysis of CHST12 based on qRT-PCR data. (d) ROC analysis of CHST12 based on the immunohistochemical score. (e) Kaplan survival analysis of the high expression and low expression CHST12 group. (f) The expression of CHST12 in GBM tissues with high and low EGFR amplification according to the data from TCGA database. (g) The expression of CHST12 in GBM tissues with mutant and wild-type IDH according to the data from the CGGA database. *P < 0.05; **P < 0.01
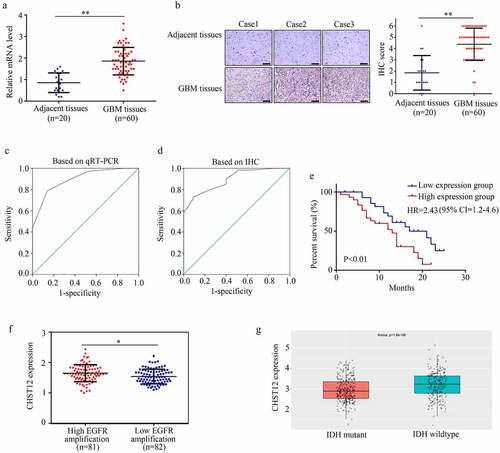
Figure 4. Knockdown of CHST12 decreased the proliferation of GBM cells. (a) Western blot was used to detect the expression of CHST12 in the CHST12 knockdown group and normal control (NC) group. (b) CCK-8 was used to detect the proliferation of the CHST12 knockdown group and NC group. (c) Colony formation assay was used to detect the colony formation ability of the CHST12 knockdown group and NC group. **P < 0.01
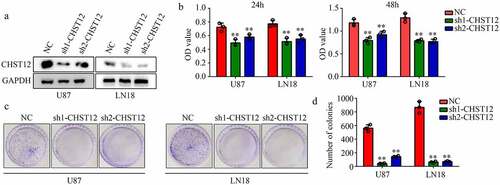
Figure 5. Knockdown of CHST12 inhibited the mobility of GBM cells. (a) Wound healing assay was used to detect the migration of CHST12 knockdown group and negative control (NC) group. The white line indicates a measurement of 250 μm. (b) Transwell assay was used to detect the invasion of CHST12 knockdown group and NC group. The black lines indicate a measurement of 100 μm.*P < 0.05; **P < 0.01
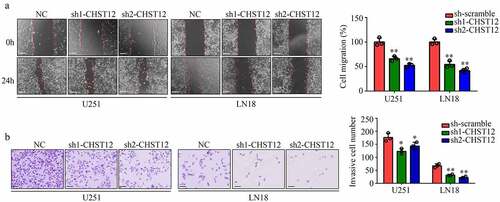
Figure 6. Knockdown of CHST12 inhibited the activation of WNT/β-catenin pathway. (a-b) The co-expression relationship between CHST12 and CTNNB1 in our GBM tissues and TCGA GBM tissues. (c) The expression of β-catenin, E-cadherin, and N-cadherin in the negative control group and CHST12 knockdown groups. (d–e) Immunofluorescent staining detected the expression of β-catenin and E-cadherin in the negative control group and CHST12 knockdown groups. The white lines indicate a measurement of 50 μm
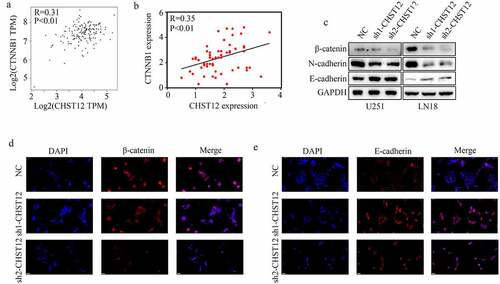
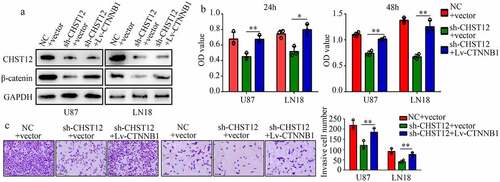
Figure 7. Restoration of the β-catenin expression reversed the effects of CHST12 knockdown. The GBM cells were divided into three groups: negative control (NC), CHST12 knockdown (sh-CHST12), and sh-CHST12 + β-catenin overexpression (Lv-β-catenin). (a) Western blot was used to detect the expression of β-catenin and CHST12 in each group. (b) CCK-8 was used to detect the proliferation in each group. (c) Transwell assay was used to detect invasion in each group. The black lines indicate a measurement of 100 μm. *P < 0.05; **P < 0.01
Data availability
The data used for analyzing the expression of members of the CHST family and their relationship with survival rate can be obtained from the GEPIA database (http://gepia.cancer-pku.cn/). Relative experimental data can be obtained from the corresponding author on reasonable request.