Figures & data
Figure 1. Isolation and identification of RGCs in mice. A, RGCs in mice under white light. B, Unstained cells were used as a blank internal reference to eliminate systematic errors. C, Positive rate of Thy1.2 cells by flow cytometry, the Thy1.2 antibody labeled treatment group. D, Statistical chart of the results by flow cytometry. The scale bar is 100 microns. ##, p < 0.01
Figure 2. Expression of RIPK1 and RIPK3 proteins in RGCs was promoted following D-glucose treatment. A, Protein expressions of RIPK1, p-RIPK1, RIPK3, and p-RIPK3 were detected by WB after treatment of 7.5 mM, 19.5 mM, and 35 mM D-glucose for 12, 24, and 48 h. B-E, Grayscale statistics
Figure 3. RIPK1 and RIPK3 were detected by immunofluorescence assay. Expression and distribution of RIPK1 and RIPK3 in cells were detected by immunofluorescence following treatment with 19.5 mM D-glucose at 12 h
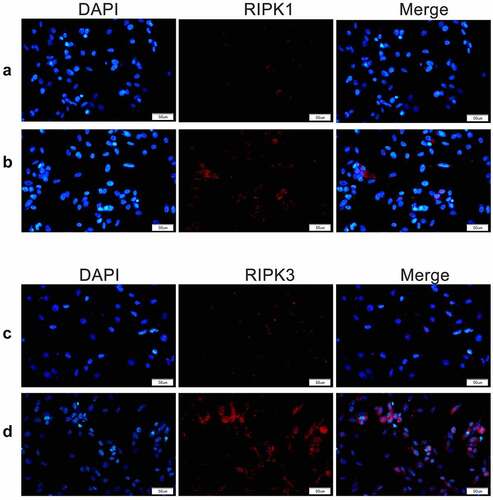
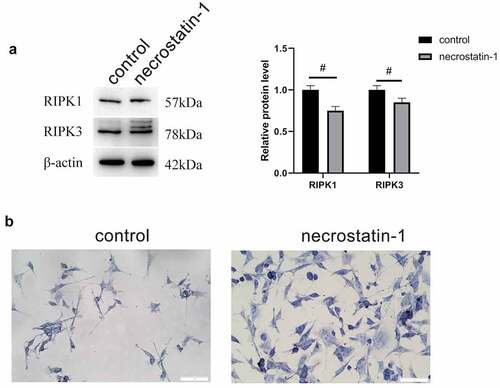
Figure 4. Necrostatin-1 inhibited the expression of RIPK1 and RIPK3. A, Protein expression levels of RIPK1 and RIPK3 by WB. B, Number of Nissl bodies by Nissl staining. #, p < 0.05