
Figures & data
Table 1. Information of microarray dataset from GEO database
Figure 1. DEGs and biofunctional analysis
: Volcano plot of 587 DEGs, of which 321 were upregulated (red) and 266 were downregulated (green). : Top 20 KEGG pathways enriched of the DEGs. : Top eight gene ontology (GO) enrichments of the DEGs.
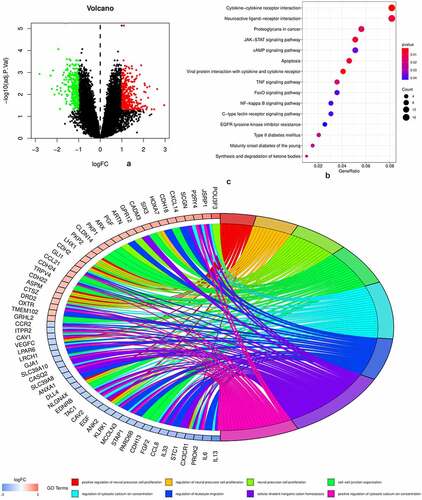
Figure 2. The PPI network of DEGs and the top 20 genes with most adjacent nodes
The ) displays the PPI network of DEGs. Each small circle represents a gene. It is obvious in the picture that some genes are highly concentrated as a module and with interaction connect to other genes. The listed the top 20 genes in the PPI network with most adjacent nodes.
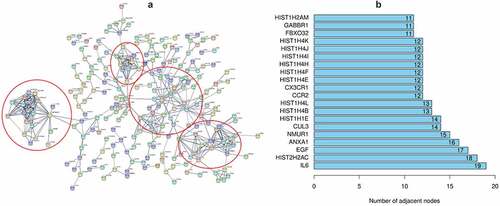
Figure 3. Immune cell infiltration in PAH and control samples
The displays the proportions of immune cell subsets in the PAH and control samples. The displays statistically significant differences in immune cell subsets.
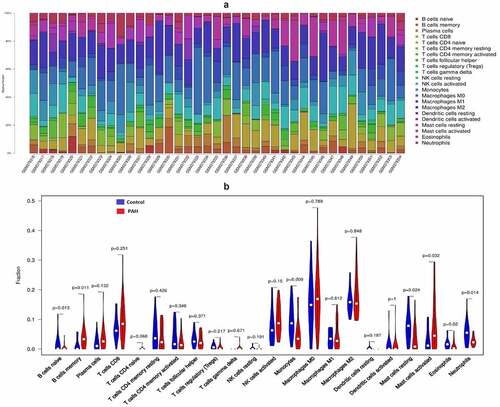
Figure 4. Hub genes identified by LASSO
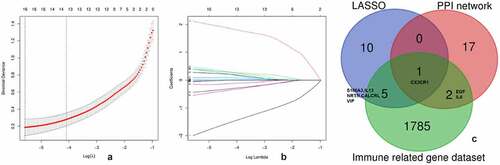
Table 2. The potential medicine of immune related genes predicted in drugBank
Figure 5. Identification and validation the biomarkers of PAH
The receiver operating characteristic (ROC) curve of the discrimination ability of CX3CR1. : AUC of CX3CR1 in GSE15197, : AUC of CX3CR1 in GSE113439, : AUC of CX3CR1 in GSE48149, : AUC of CX3CR1 in GSE33463.
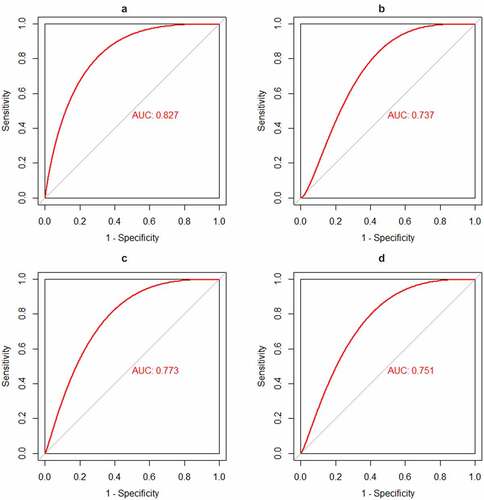
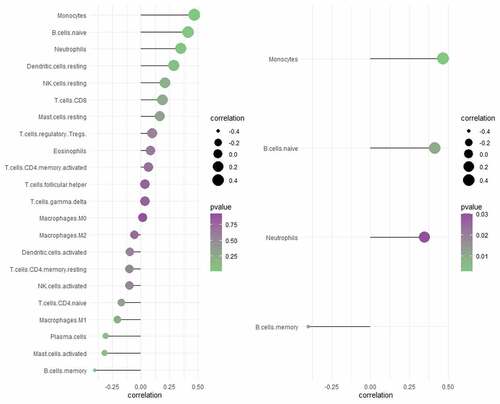
Figure 6. Correlation analysis between CX3CR1 with 22 immune cells
The left image shows correlation analysis between CX3CR1 with 22 types of immune cells. The right image shows the immune cells with the strongest correlation with CX3CR1 and P-value< 0.05. The size of the dots represents the strength of correlation between gene biomarkers and immune cells. The color of the dots represents the P-value.
Supplemental material
Supplemental Material
Download ()Availability of data and materials
The datasets used and/or analyzed during the current study are available from the Gene Expression Omnibus (GEO) database.