Figures & data
Figure 1. MIR22HG was significantly overexpressed in OA. (a) qRT-PCR was used to measure the expression level of MIR22HG in normal (n = 10) and OA cartilage (n = 20), *P < 0.05. (b) qRT-PCR was used to measure the expression level of MIR22HG in normal and OA chondrocyte. (c)The expression level of MIR22HG in IL-1β-stimulated chondrocyte detected using qRT-PCR. The ΔCt values were used to measure gene expression, which was normalized to the expression level of GAPDH. The results are shown as the mean ± SEM of at least three independent experiments (*P < 0.05)
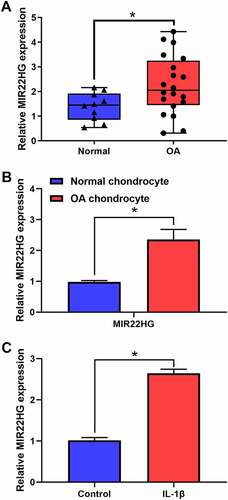
Figure 2. Inhibition of MIR22HG accelerated cell proliferation and suppressed apoptosis and cartilage matrix degeneration in IL-1β-induced chondrocyte. (a)The silence efficiency of si-MIR22HG were detected using qRT-PCR. CCK8, flow cytometry, qRT-PCR, and western blot were employed to measure chondrocyte proliferation(b), apoptotic (c, d), and the mRNA(e) and protein(f) expression level of COL2A1, ACAN, MMP13, ADAMTS5 in IL-1β-stimulated chondrocyte. The results are shown as the mean ± SEM of at least three independent experiments (*P < 0.05)
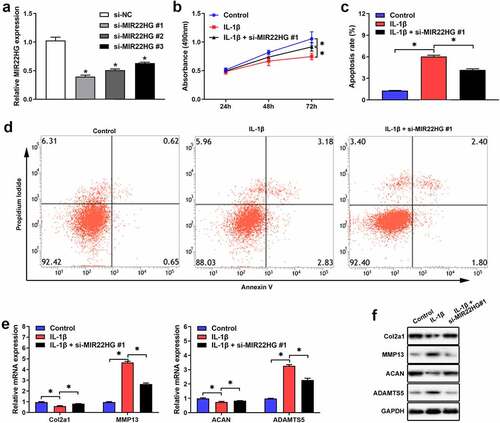
Figure 3. MIR22HG targeted miR-9-3p in chondrocyte. (a)The possible complementary sequences between MIR22HG and miR-9-3p was predicted by Starbase. (b)The luciferase activities in 293 T cells was examined using luciferase reporter assay after transfecting MIR22HG-wt and miR-9-3p mimic. (c) The relative enrichment of MIR22HG and miR-9-3p were examined using RIP experiments. (d)qRT-PCR was used to detect the expression level of miR-9-3p after silencing of MIR22HG. (e) The expression level of miR-9-3p in OA and normal cartilage were measured using qRT-PCR, *P < 0.05. (f)The correlation between the expression of MIR22HG and miR-9-3p in OA cartilage was estimated using Pearson analysis. The results are shown as the mean ± SEM of at least three independent experiments (*P < 0.05)
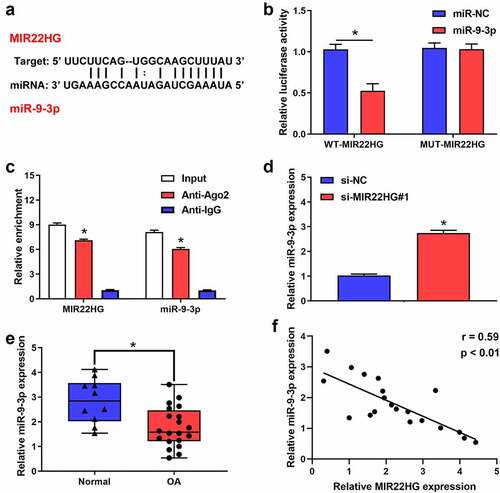
Figure 4. ADAMTS5 acts as a downstream targeted mRNA of miR-9-3p. (a)The possible binding sites between ADAMTS5 and miR-9-3p was predicted using Targetscan. (b)Luciferase reporter was used to validate the binding relationship of ADAMTS5 and miR-9-3p in 293 T cells. qRT-PCR(c) and western blot(d) were employed to measure the expression of ADAMTS5 after transfecting miR-9-3p mimics and NC. (e)The expression level of ADAMTS5 in OA and normal cartilage was examined using qRT-PCR. (f) The correlation between miR-9-3p and ADAMTS5 in OA cartilage was estimated using Pearson analysis. The results are shown as the mean ± SEM of at least three independent experiments (*P < 0.05)
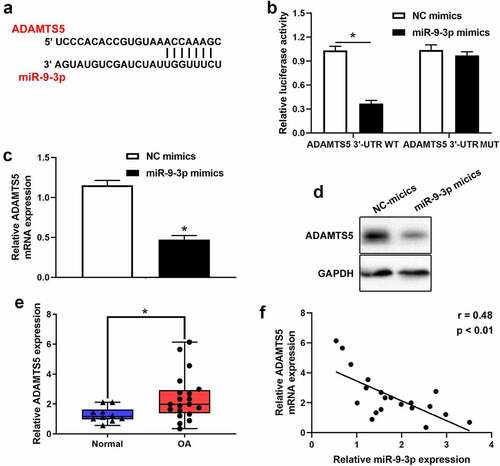
Figure 5. miR-9-3p targets ADAMTS5 to inhibit IL-1β-triggered chondrocytes injury. CCK8, flow cytometry, and western blot were employed to measure the protein expression of ADAMTS5(a), chondrocytes proliferation(b), apoptosis(c), and the expression level of COL2A1, ACAN, ADAMST5 and MMP13 (d) in IL-1β-induced chondrocyte following transfected with miR-9-3p mimics or ADAMTS5. The results are shown as the mean ± SEM of at least three independent experiments (*P < 0.05)
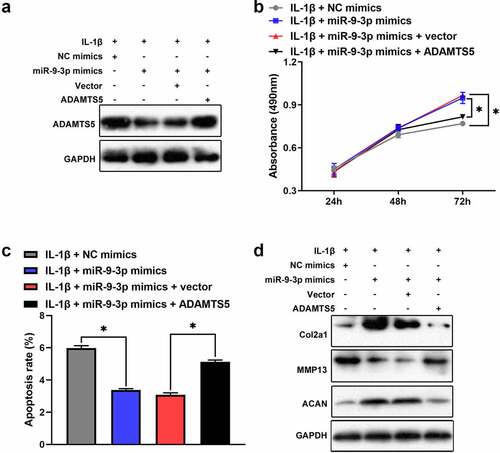
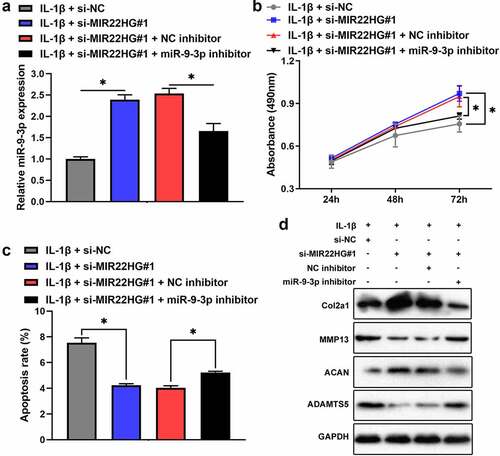
Figure 6. Inhibition of miR-9-3p partly arrested the biological functions of MIR22HG knockdown on IL-1β-stimulated chondrocytes. The mRNA level of miR-9-3p (a), cell proliferation(b), apoptosis(c), and the protein level of COL2A1, ACAN, MMP13, ADAMTS5 (d) were examined in IL-1β-stimulated chondrocyte after transfected with miR-9-3p inhibitor or si-MIR22HG using qRT-PCR, CCK8, flow cytometry, and western blot. The results are shown as the mean ± SEM of at least three independent experiments (*P < 0.05)