
Figures & data
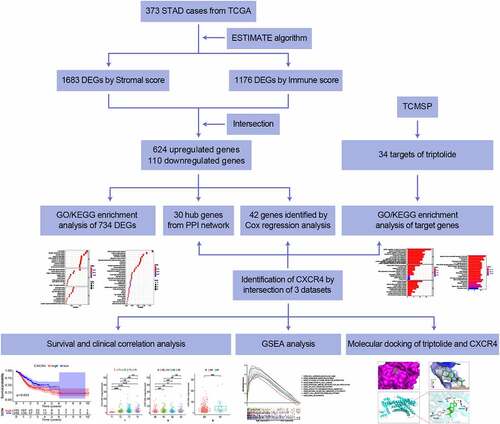
Figure 1. Box plots of correlation between ESTIMATE scores with clinicopathological staging characteristics. (2a, 2b, 2 c) StromalScore, ImmuneScore and ESTIMATEScore of STAD patients in each stage. (2d, 2e, 2 f) StromalScore, ImmuneScore and ESTIMATEScore of STAD patients in each grade. (2 g, 2 h, 2i) StromalScore, ImmuneScore and ESTIMATEScore of STAD patients in each tumor classification. (2 j, 2k, 2 l) StromalScore, ImmuneScore and ESTIMATEScore of STAD cases with or without lymph node metastasis. (2 m, 2 n, 2o) StromalScore, ImmuneScore and ESTIMATEScore of STAD cases with or without distant metastasis. P-values based on the Wilcoxon signed-rank test; p < 0.05 was statistically significant
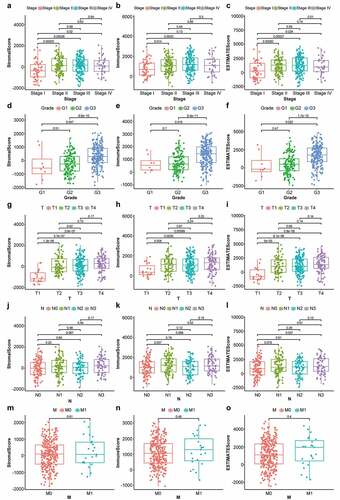
Figure 2. Heatmaps, Venn diagrams, and enrichment analysis of the DEGs. (2a) Heatmapped DEGs within the stromal high-scoring group versus low-scoring group (|logFC| >1; FDR < 0.05 based on Wilcoxon test); red represents higher expression and blue represents lower expression. (2b) Heatmapped DEGs in immune high-scoring group versus low-scoring group (|logFC| >1; FDR < 0.05 based on Wilcoxon test); red represents higher expression and blue indicates lower expression. (2 c) Venn diagram of 624 commonly upregulated genes (stromal/immune-linked scorings). (2d) Venn diagram of 110 commonly downregulated genes (stromal/immune-linked scorings). (2e) Ten highest-ranking GO terms for BP, CC and MF enriched using DEGs shared by stromal and immune scores (q value < 0.05). (2 f) Top 30 KEGG terms enriched by DEGs and ranked by q values from highest to lowest (q value < 0.05)
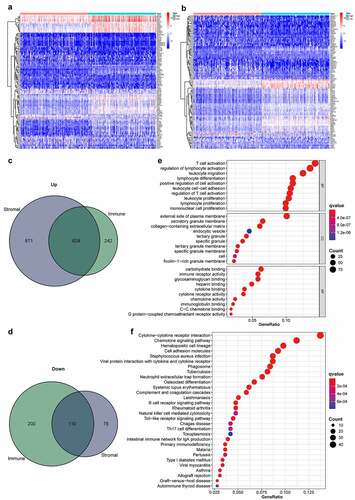
Table 1. List of 34 triptolide targets and their respective UniProt Entry IDs and gene names
Figure 3. CXCR4, a hub gene from the PPI network, correlated with STAD prognosis and was identified as a target gene of triptolide. (3a) PPI network (STRING) based on DEGs (combined score = 0.95). (3b) Interaction network constructed using Cytoscape v3.7.2 based on DEGs with a minimum required interaction score > 0.95; green and red illustrate downregulated and upregulated genes, respectively. (3 c) Sub-network of 30 hub genes filtered by Cytohubba MCC method; node score increases from light to dark color. (3d) Forest plot of Cox regression analysis with DEGs; genes with p < 0.05 and HR > 1 were identified as high-risk factors for STAD prognosis. (3e) Venn diagram of 30 hub genes from the PPI network, 42 prognosis-related genes based on Cox regression analysis, and 34 target genes of triptolide
Figure 4. Comparison between CXCR4 expression with prognosis/clinicopathological features in STAD patients. (4a, 4b) Difference analysis and paired difference analysis showed significantly higher CXCR4 expression levels in STAD tissues versus normal tissues (p < 0.05, Wilcoxon test). (4 c) Patients were categorized into CXCR4 high-/low-expressing cohorts; survival curve showed that CXCR4 was linked to poor prognosis of STAD patients (p = 0.003). (4d) CXCR4 expression levels were significantly higher in T2/3/4 versus T1 and in T4 versus T2 (p < 0.05). (4e) No correlation detected between CXCR4 expression and N classification (p > 0.05). (4 f) CXCR4 showed no difference between patients with and without metastasis (p = 0.059)
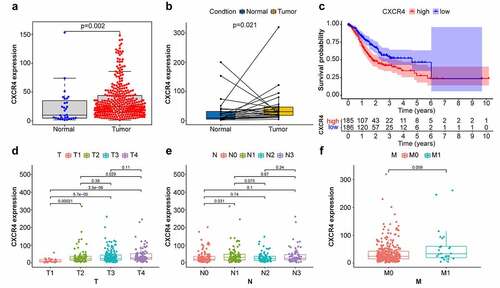
Table 2. Top 10 pathways enriched by genes in the CXCR4 high-expression group based on GSEA (in the order of FDR q value)
Figure 5. GSEA of top ten KEGG pathways with the highest FDR q values for samples with high CXCR4 expression. Individual lines represent a specific KEGG pathway and associated color; left-hand-side genes were positively associated with CXCR4, and genes on the right negatively correlated with CXCR4
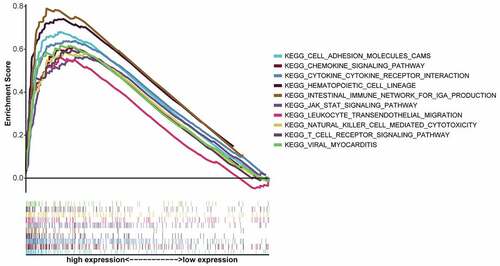
Figure 6. Enrichment analysis of triptolide target genes and molecular docking between triptolide and CXCR4. (6a) Ten highest-ranking GO terms for BP, CC, and MF enriched by triptolide targets (q value < 0.05). (6b) Top 15 KEGG pathways enriched by triptolide targets and ranked by q values from the highest to the lowest. (6 c) The optimal mode of molecular interaction between triptolide and CXCR4 is shown in its three-dimensional model and the binding point is located in the center of the active binding pocket. (6d) Hydrophobicity of molecular interaction between triptolide and CXCR4. (6e) Hydrogen bonds are formed with Tyr121, Arg188, and Tyr255
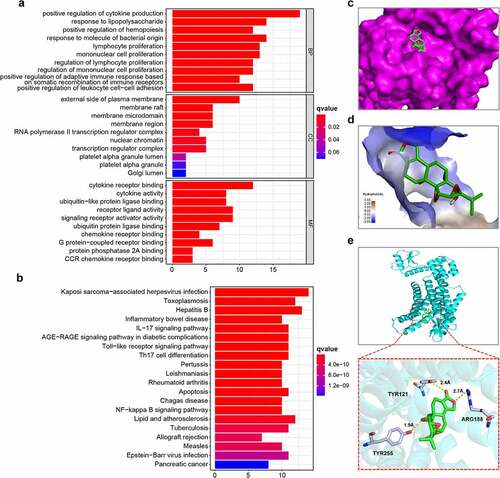
Table 3. List of 15 cancer- and CXCR4-related KEGG pathways significantly enriched by 34 targets of triptolide
Table 4. Molecular docking parameters of 20 docking modes
Data availability statement
The datasets analyzed in the present study are publicly available at https://portal.gdc.cancer.gov/ and https://tcmspw.com/tcmsp.php. Structures of triptolide and CXCR4 were available online at https://pubchem.ncbi.nlm.nih.gov/. and http://www1.rcsb.org/, respectively.