Figures & data
Table 1. Detail information of datasets included in this study
Figure 1. The mRNA expression levels of IL-27 (IL-27p28 and EBI3) and IL-27 receptor (IL-27Rα and gp130) in term and preterm pregnancies samples. (a) maternal peripheral blood, (b) chorion tissues, (c) placenta tissues, (d) myometrium tissues, and (e) decidua tissues
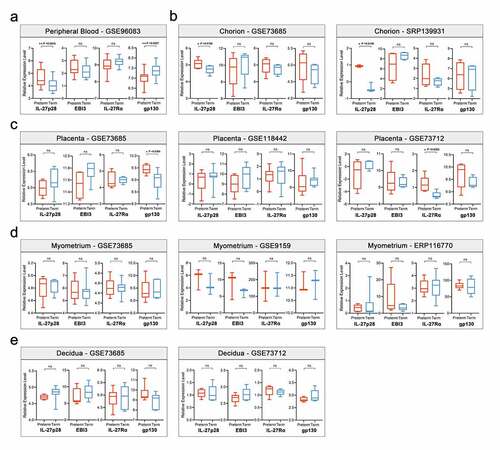
Figure 2. The characteristics of IL-27p28-correlated genes. (a) Pearson’s correlation coefficients of IL-27p28-correlated genes in maternal peripheral blood and chorion tissues. (b) Heatmap of expressions of IL-27p28-correlated genes in preterm and term pregnancies. (c) PPI network of IL-27p28-correlated genes in maternal peripheral blood. (d) Venn analysis of IL-27p28-correlated genes in maternal peripheral blood and chorion tissues
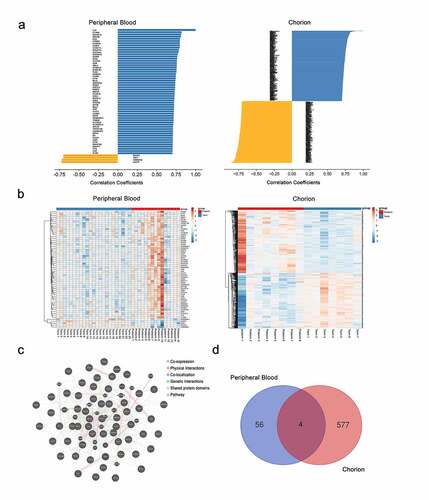
Figure 3. Visualizations of GO and KEGG analysis. (a, c) The network of enriched GO and KEGG terms colored by the cluster. The most significant enriched terms in (b) maternal peripheral blood and (d) chorion tissues
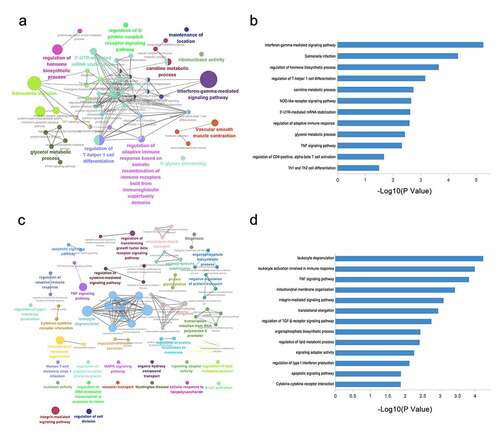
Figure 4. Gene Set Enrichment Analysis. The hallmark pathways associated with IL-27p28 overexpression in (a) maternal peripheral blood and (c) chorion tissues. The immune changes associated with IL-27p28 overexpression in (b) maternal peripheral blood and (d) chorion tissues
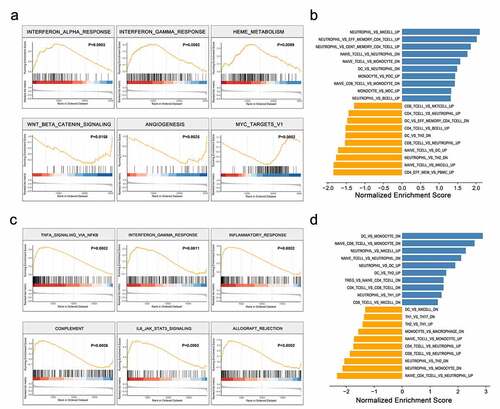
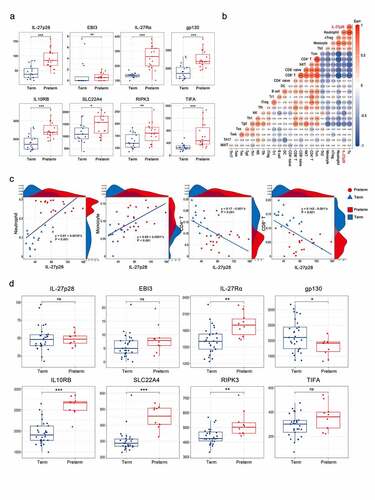
Figure 5. Correlation between IL-27p28 expression and immune sub-cells in PTB. The different immune cells in (a) maternal peripheral blood and (c) chorion tissues. The linear regression analysis for the immune cells and IL-27p28 in (b) maternal peripheral blood and (d) chorion tissues. (e, f) Pearson’s correlation coefficients between the immune cells and IL-27p28. (Th: T helper; Tfh: T follicular helper; Treg: regulatory T; Tgd: γδ T; Tem: effector memory T; Tcm: central memory T; Tc: cytotoxic T; Tex: exhausted T; Tr1: Type 1 regulatory T; MAIT: mucosal-associated invariant T; NK: Natural killer; NK T: Natural killer T. * indicates P < 0.05; ** indicates P < 0.01; *** indicates P < 0.001.)
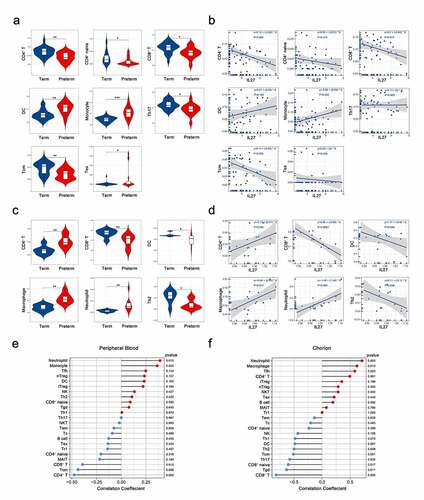
Figure 6. Validation of IL-27p28 expression level and its role in PTB. (a) The mRNA expression of IL-27 (IL-27p28 and EBI3), IL-27 receptor (IL-27Rα and gp130) and associated genes in the peripheral blood of preterm and term pregnancies. (b) The correlations between IL-27p28 expression level and immune cells in PTB. (c) The linear regression analysis for the immune cells and IL-27p28. (d) The mRNA expression levels of IL-27 (IL-27p28 and EBI3), IL-27 receptor (IL-27Rα and gp130) and related genes in the peripheral blood monocyte of preterm and term pregnancies. (* indicates P < 0.05; ** indicates P < 0.01; *** indicates P < 0.001)