Figures & data
Table 1. Clinical characteristics of prostate cancer patients
Table 2. Characteristics of CpG sites selected by LASSO
Figure 1. (a) The raw data of beta-values in methylated CpG site.
The normalized beta-values of methylation of CpG site.
One thousand most variable CpG sites were screened using ‘minfi’
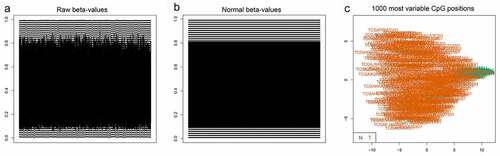
Figure 2. A CpG sites were selected in LASSO analysis.B LASSO coefficient profiles of the CpG sites.C Hierarchical clustering by differential levels in methylated CpG sites
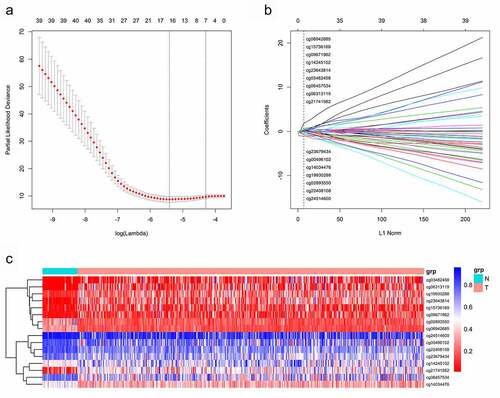
Figure 3. The methylated levels of 8 CpG sites were up-regulated and 8 CpG sites were down-regulated in PCa compared with para-carcinoma tissues
Figure 4. (a)Time-dependent ROC analysis was carried out to estimate the predictive effect for OS at varied follow-up periods.(b) SKaplan–Meier analysis was used to estimate the OS in patients. The patients were divided into high-risk group or low-risk group based on the median cutoff point of risk score
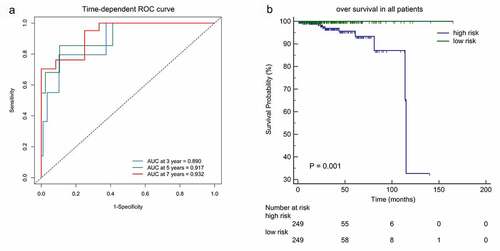
Figure 5. Kaplan-Meier analyses with high-risk or low-risk score of methylation beta-values of single CpG site in the classifier
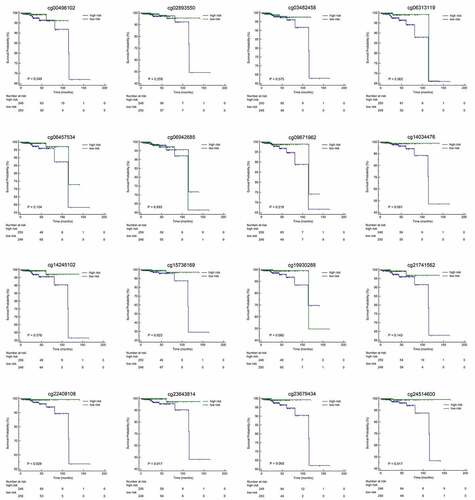
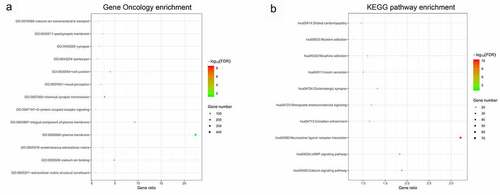
Figure 6. Functional enrichment analysis of lncRNA co-expression genes
Gene Oncology (GO) enrichment
KEGG pathway enrichment.