
Figures & data
Figure 1. Differentially expressed autophagy-associated genes in esophageal adenocarcinoma (EAC) and non-tumor samples. (a) The volcano map of 213 autophagy-associated genes. The red dots indicate upregulated genes and the blue dots represent downregulated genes. (b) Hierarchical clustering distribution of differentially expressed autophagy-associated genes in EAC tissues and normal tissues
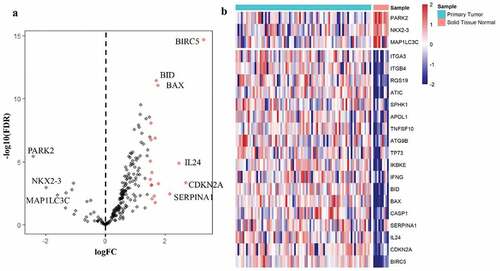
Figure 2. GO and KEGG enrichment analysis. (a) GO analysis of 21 differentially expressed autophagy-related genes. ‘BP’ represents ‘biological process’, ‘CC’ represents ‘cellular component’ and ‘MF’ represents ‘molecular function’. (b) KEGG analysis of 21 differentially expressed autophagy-related genes
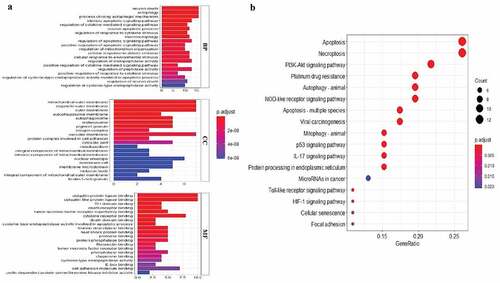
Figure 3. Selection of autophagy genes associated with the survival of esophageal adenocarcinoma by univariate Cox regression analysis. (a) Forest plot of autophagy genes associated with TCGA-EAC survival. (b) Differential expression of the 12 selected genes between normal and EAC tissues
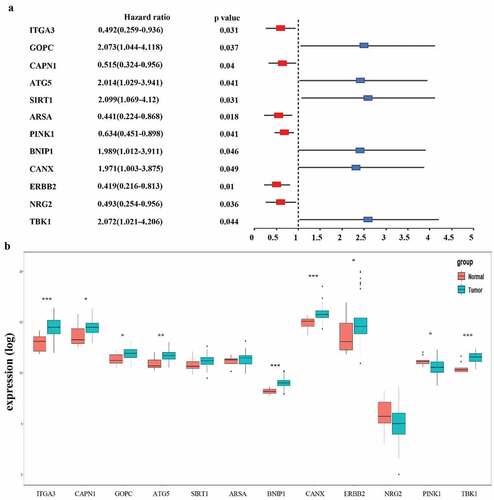
Table 1. Functions of genes in the prognostic gene signatures
Figure 4. Establishment of prognostic gene signature by LASSO regression analysis. (a) Lasso coefficient profiles of the 12 autophagy-associated genes in EAC. (b) The optimal lambda value in Lasso model. (c) Genetic alteration of 9 autophagy-associated genes in the ESCA cohort (TCGA, PanCancer Atlas). (d) Genetic alteration of 9 autophagy-associated genes in the ESCA cohort (TCGA, Firehose Legacy)
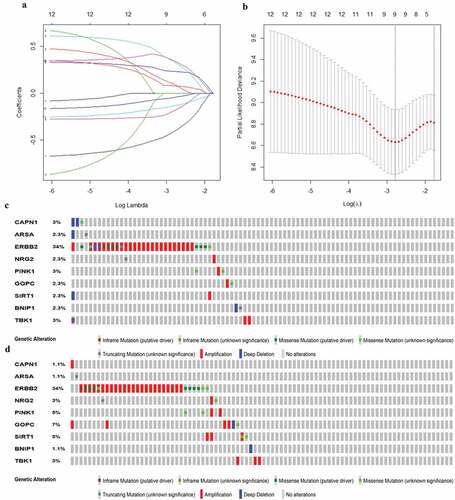
Figure 5. Characteristics of the prognostic gene signature. (a) Heatmap of the autophagy-associated gene expression profiles in prognostic signature for TCGA-EAC. (b) The distribution of risk score and patient’s survival time, as well as status for TCGA-EAC
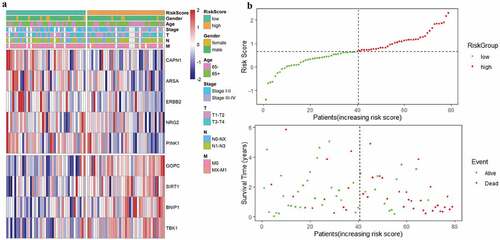
Figure 6. Autophagy-associated gene signature was significantly associated with EAC survival. (a) Univariate Cox regression analysis. Forest plot of associations between risk factors and the survival of EAC. (b) multivariate Cox regression analysis. The autophagy-associated gene signature is an independent predictor of TCGA-EAC. (c) Kaplan–Meier analysis of TCGA EAC patients was stratified by median risk. High risk scores are associated with general poor survival of TCGA-EAC. (d) ROC curve of OS-related prognostic model. (e) ROC curves were used to assess the efficiency of the risk signature for predicting 1- and 3-year survival
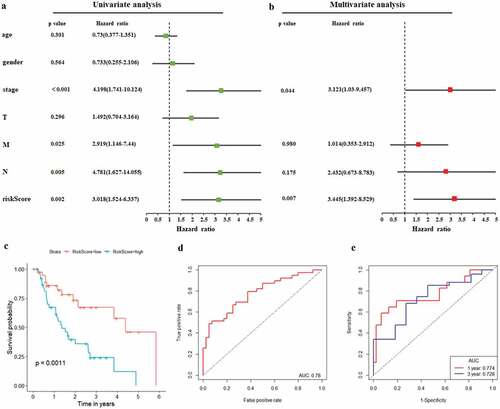
Figure 7. The correlation between ARGs included in OS-related prognostic signature and EAC patients’ survival
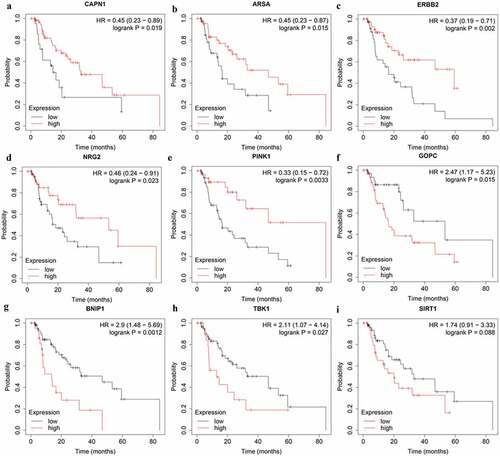
Figure 8. Confirmation of the signature stratified by different clinical factors in the TCGA EAC cohort. Kaplan–Meier survival for OS in subgroups stratified by age<65 (a) age≥65 (b) T1,2(c) T3,4(d) N0,X (e) N1,2,3 (f) stage I,II (g) stage III,IV (h) in the TCGA cohort
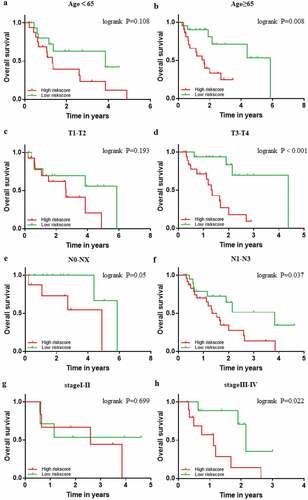
Figure 9. GSEA analysis of the 9-gene signature between high and low risk groups. GSEA analysis showed that the high-risk group were significantly associated with meiosis-related processes (a), condensed chromosome (b), DNA-dependent ATPase activity (c), cell cycle (d), PPAR signaling pathway (e), as well as RNA transport (f)
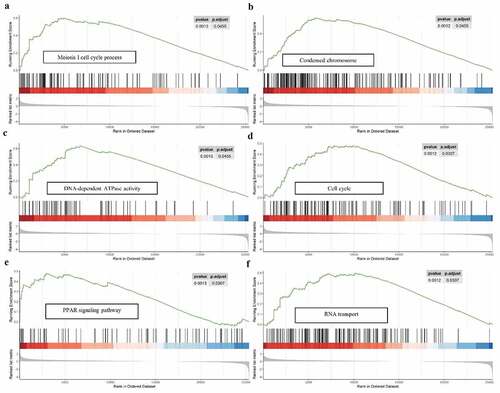
Figure 10. Risk scores of 9-autophagy gene signature were significantly associated with survival in GSE13898 cohort. The Kaplan-Meier survival curve (a), ROC curve (b), heatmap (c), and distribution of risk score (d) for the Kim cohort
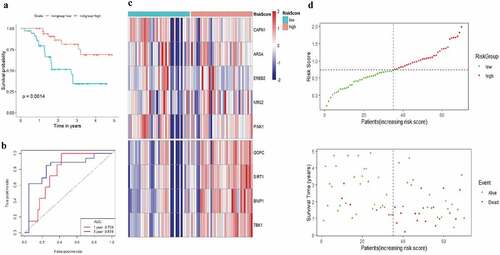
Figure 11. The nomogram to anticipate prognostic probabilities in TCGA-EAC. (a) The nomogram for predicting the OS of TCGA-EAC cohort (training set). The above line indicates the risk point for each factor which can be summed up to obtain a overall risk point and the bottom two line indicate the 1-year and 3-year survival possibility. (b–c) The calibration plots for predicting 1-year (b) and 3-year survival (c) in the training set. The calibration plots of 1-year (d) and 3-year survival (e) in the GSE13898 EAC cohort (testing set). The x-axis and y-axis stood for the predicted and actual survival rates of the nomogram, respectively. The solid line indicated the predicted nomogram and the vertical bars represent the 95% confidence interval. The closer the solid line is to the diagonal, the better the prediction
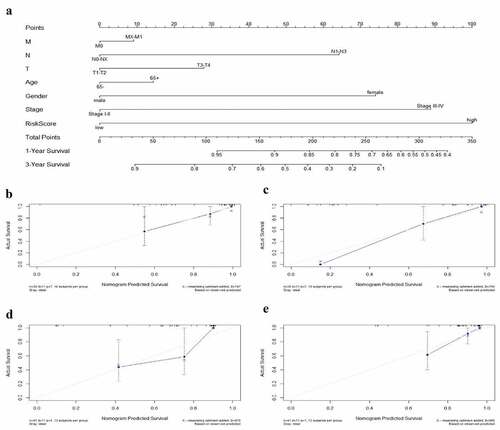
Figure 12. Mutation, CNV, and methylation analysis of ERBB2 in EAC. (a) Heatmap showing the correlations between ERBB2 mRNA and CNV, somatic mutations, and methylation in HCC via UCSC Xena. (b) The correlation between ERBB2 mRNA and somatic mutation in EAC. (c) The correlation between ERBB2 mRNA and CNV in EAC. (d) The correlation between ERBB2 mRNA and CNV in 974 cancer cell lines. (e) The correlation between ERBB2 mRNA and CNV in 27 esophageal cancer cell lines. (f) The correlation between ERBB2 mRNA and methylation in EAC. (g) The correlation between ERBB2 mRNA and methylation in 831 cancer cell lines. (h) The correlation between ERBB2 mRNA and methylation in 20 esophageal cancer cell lines. (A) was from UCSC Xena (https://xenabrowser.net/heatmap/), (B), (C), (F) were from the cBioportal for Cancer Genomics (http://www.cbioportal.org/), (D), (E), (G), (H) were from cancer cell line encyclopedia (CCLE) (https://portals.broadinstitute.org/ccle)
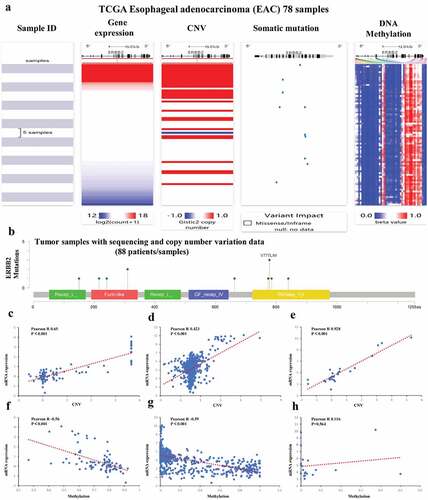
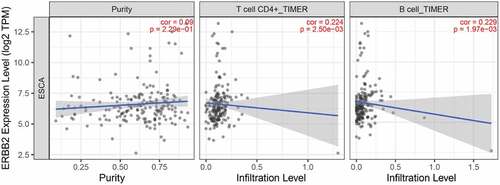
Figure 13. Correlation of ERBB2 expression with immune infiltration level in the TIMER database. ERBB2 expression level was positively related to infiltrating levels of CD4 + T cells and B cells
Data Availability Statement
All data generated or analyzed during this study are included in this article. The TCGA data portal (https://portal.gdc.cancer.gov/); the GSE13898 dataset (https://www.ncbi.nlm.nih.gov/geo/query/acc.cgi?acc=GSE13898).