Figures & data
Table 1. The baseline characteristics of 30 ovarian cancer patients
Table 2. Primer sequences
Figure 1. miR-502-5p might be a significant participant in OC by suppressing GINS2
The Venn diagram showing the common results of the prediction results of miR-502-5p and the DEGs from GEPIA OC data (http://gepia2.cancer-pku.cn/#degenes).The top 5 most ranked genes according to their context++ score in targetscan algorithm were listed.
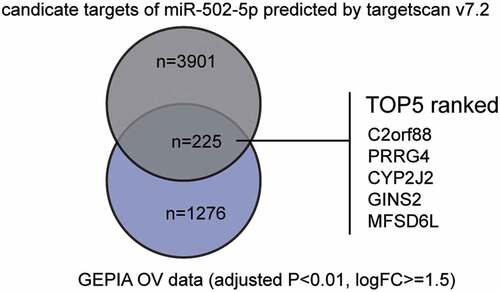
Figure 2. MiR-502-5p inhibited cell proliferation and migration, and promoted cell apoptosis in OC
(a) RT-qPCR detection of miR-502-5p expression in OC tissues and normal tissues. (b) Measurement of miR-502-5p expression in OC cells lines (SKOV3, CaOV3, and OVCAR3) and normal ovarian epithelial cell (HOSEpiC). (c) Measurement of miR-502-5p expression in CaOV3 and SKOV3 cells transfected with NC, miR-502-5p inhibitor and miR-502-5p mimic by RT-qPCR. (d) Cell viability was detected in CaOV3 and SKOV3 cells transfected with miR-502-5p mimic, miR-502-5p inhibitor and NC by CCK-8 assay. (e) Cell proliferation was detected in CaOV3 and SKOV3 cells transfected with miR-502-5p mimic, miR-502-5p inhibitor and NC by BrdU assay. (f) Cell apoptosis level was determined in CaOV3 and SKOV3 cells transfected with NC, miR-502-5p inhibitor and miR-502-5p mimic. (g) The expression of cleaved and total caspase-3 protein expression was determined in CaOV3 and SKOV3 cells transfected with NC, miR-502-5p inhibitor and miR-502-5p mimic. (h) Cell migration level was determined in CaOV3 and SKOV3 cells transfected with NC, miR-502-5p inhibitor and miR-502-5p mimic. *, P < 0.05; **, P < 0.001. NC, negative control; mimic, miR-502-5p mimic; inhibitor, miR-502-5p inhibitor.
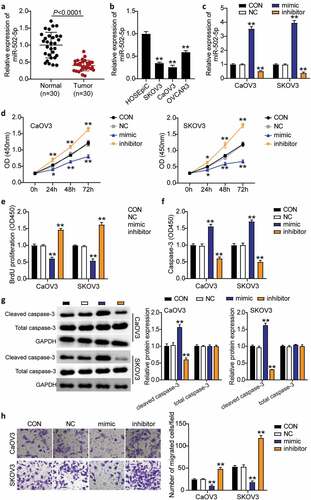
Figure 3. MiR-502-5p targeting GINS2 and inhibited the expression of GINS2
(a) Bioinformatics analysis showed the binding sequence of miR-502-5p and GINS2 3ʹ-UTR. (b) RT-qPCR detection of expression of GINS2 in the OC tissues and normal tissues. (c) Correlation analysis between the miR-502-5p expression and GINS2 expression in the OC tumor tissues. (d) Measurement of GINS2 expression in OC cells lines (SKOV3, CaOV3, and OVCAR3) and normal ovarian epithelial cell (HOSEpiC). (e) Dual luciferase assay was performed in cells co-transfected with plasmids GINS2-WT or GINS2-MUT and miR-NC or miR-502-5p mimic in CaOV3 and SKOV3 cells. (f) RT-qPCR detection of expression of GINS2 in CaOV3 and SKOV3 cells transfected with Bio- miR-502-5p NC or Bio- miR-502-5p mimic. *, P < 0.05; **, P < 0.001. WT, wild-type; MUT, mutant; NC, negative control.
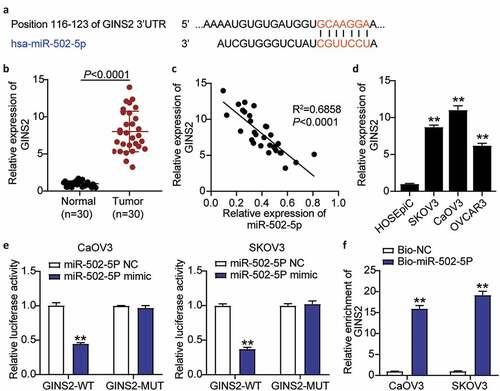
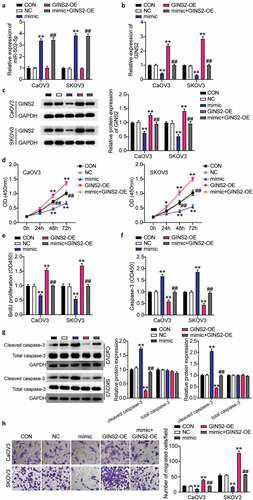
Figure 4. MiR-502-5p targeting GINS2 repressed the progression of OC
(a) Measurement of miR-502-5p expression in CaOV3 and SKOV3 cells transfected with NC, OE- GINS2, mimic, and OE+ mimic by RT-qPCR. (b) Measurement of GINS2 expression in CaOV3 and SKOV3 cells transfected with NC, OE- GINS2, mimic, and OE+ mimic by RT-qPCR. (c) Measurement of GINS2 protein expression in CaOV3 and SKOV3 cells transfected with NC, OE- GINS2, mimic, and OE+ mimic by western blot. (d) Cell viability was detected in CaOV3 and SKOV3 cells transfected with NC, OE- GINS2, mimic, and OE+ mimic by CCK-8 assay. (e) Cell proliferation was detected in CaOV3 and SKOV3 cells transfected with NC, OE- GINS2, mimic, and OE+ mimic by BrdU assay. (f) Cell apoptosis was determined in CaOV3 and SKOV3 cells transfected with NC, OE- GINS2, mimic, and OE+ mimic by Caspase-3 apoptosis detection kit. (g) The expression of cleaved and total caspase-3 protein expression was determined in CaOV3 and SKOV3 cells transfected with NC, OE- GINS2, mimic, and OE+ mimic. (h) Cell migration level was determined in CaOV3 and SKOV3 cells transfected with NC, OE- GINS2, mimic, and OE+ mimic. *, P < 0.05; **, P < 0.001 compared with CON; #, P < 0.05; ##, P < 0.001 mimic+GINS2-OE compared with GINS2-OE. NC, negative control; OE- GINS2, overexpression-GINS2; mimic, miR-502-5p mimic. OE+ mimic, overexpression-GINS2+ miR-502-5p mimic.