Figures & data
Figure 1. C-Jun expression in intervertebral disc tissue at 4, 8, and 12 weeks following the establishment of disc degeneration model. (a) The mRNA expression of c-Jun was subjected to qRT-PCR. (b) Protein levels of c-Jun were detected by western blot. Pairwise data analysis employed one-way ANOVA followed by post hoc Tukey’s test (mean ± SD, n = 5). ‘**’ p < 0.01
Figure 2. The histological structure of intervertebral disc tissue in rats was influenced by c-Jun overexpression at 4, 8, and 12 weeks after establishing models of disc degeneration. (a) Histological changes were visualized via HE staining. The scale bar was 50 μm, magnification, 100 × . (b) Collagen fiber was observed using transmission electron microscopy. The scale bar was 2 μm at a magnification of 8000 ×
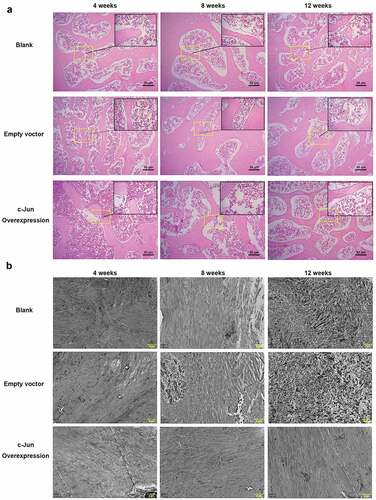
Figure 3. Expressions of TGF-β, TIMP-3, and COL2A1 in disc degeneration tissue were increased after overexpressing c-Jun. (a) The mRNA expressions of TGF-β, TIMP-3, and COL2A1 were detected using qRT-PCR assays. (b) The protein expressions of TGF-β, TIMP-3, and COL2A1 were determined using western blot assays. (c) Relative density of TGF-β, TIMP-3, and COL2A1 in (B) was analyzed by Image J. (d) The protein expressions of TGF-β, TIMP-3, and COL2A1 were assumed by immunohistochemistry. Scale bar, 50 μm, magnification, 400 × . One-way ANOVA followed by post hoc Tukey’s test was used for data analysis (mean ± SD, n = 5). ‘*’ p < 0.05 ‘**’ p < 0.01
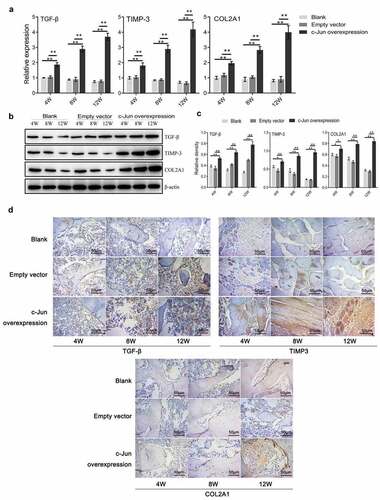
Figure 4. The expressions of TNF-α, IL-1β, IL-6, and IL-17 in disc degeneration tissue were decreased after overexpressing c-Jun. (a) The mRNA expressions of TNF-α, IL-1β, IL-6, and IL-17 were determined using qRT-PCR. (b) The protein levels of TNF-α, IL-1β, IL-6, and IL-17 were detected using Elisa. Data analysis employed the one-way ANOVA followed by post hoc Tukey’s test (mean ± SD, n = 5). ‘**’ p < 0.01