
Figures & data
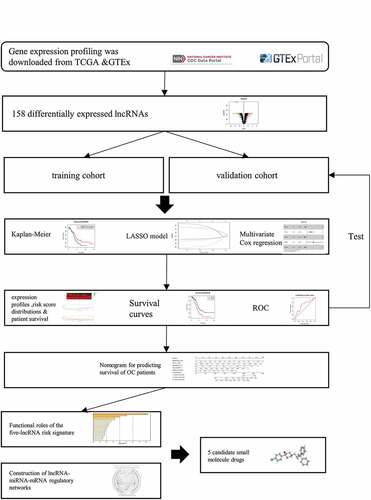
Figure 1. Identification of differentially expressed lncRNAs (DElncRNAs) for constructing the risk signature for OC. (a) Principal components analysis of lncRNAs between OC and normal ovarian tissue. (b) Volcano plot shows the distribution of DElncRNAs. Red and green dots represent the up-regulated and down-regulated DElncRNAs with | log2(fold-change) | ≥ 2, respectively (c) Heatmap exhibits the expression levels of the DElncRNAs. (d) Boxplot shows the detail of DElncRNAs. Red and green boxes indicate the lncRNA expression in OC and in normal ovarian tissue, respectively
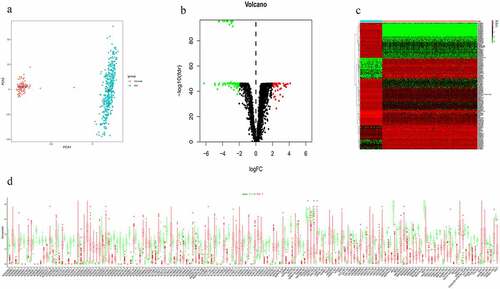
Figure 2. Differentially expressed lncRNA (DElncRNAs) for risk signature construction. (a) Log (Lambda) value of the 7 lncRNAs in the least absolute shrinkage and selection operator (LASSO) regression. (b) The most appropriate log (Lambda) value in the LASSO model. (c) Multivariate Cox regression analysis was performed and 5 lncRNAs (AC092718.4, AC138035.1, BMPR1B-DT, RNF157-AS1, and TPT1-AS1) were selected to construct the risk signature. (d-h) Kaplan–Meier analysis showed overall survival differences between low-risk and high-risk groups in AC092718.4, AC138035.1, BMPR1B-DT, RNF157-AS1, and TPT1-AS1, respectively
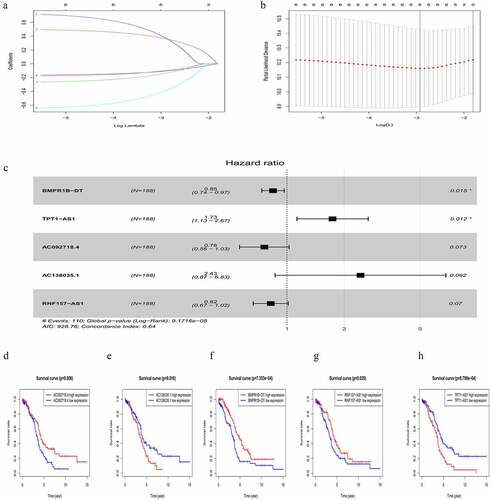
Figure 3. Characteristics of the five-lncRNA risk signature in the training cohort. (a) LncRNA expression profiles, risk score distributions and patient survival in the training cohort. (b) Survival curves for high-risk and low-risk groups decided by the risk signature in the training cohort. (c-e) ROC of the five-lncRNA risk signature in predicting the 1-, 3-, and 5-year survival in the training cohort
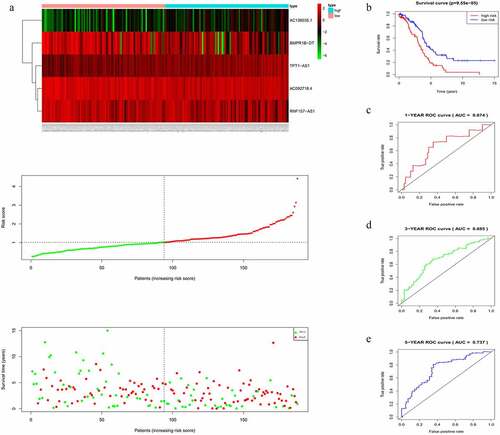
Figure 4. Evaluating the efficacy of the five-lncRNA risk signature in the validation cohort. (a) LncRNA expression profiles, risk score distributions and patient survival in the validation cohort. (b) Survival curves for high-risk and low-risk groups decided by the risk signature in the validation cohort. (c-e) ROC of the five-lncRNA risk signature in predicting the 1-, 3-, and 5-year survival in the validation cohort

Figure 5. Construction of lncRNA-miRNA-mRNA regulatory networks with functional annotations and signaling pathways. (a) LncRNAs as well as their potential binding miRNAs and target genes with | r | ≥ 0.4 related to the five lncRNAs were used to construct the lncRNA-miRNA-mRNA regulatory networks. However, due to the huge number of genes in the networks, only mRNAs with | r | ≥ 0.4 are visualized here. Blue hexagons represent lncRNAs, which are located at the cores of the networks. Red ellipses and green triangles stand for miRNAs and mRNAs, respectively. Gene oncology (b) and KEGG pathway (c) analyses were performed based on the target genes of the networks via Metascape
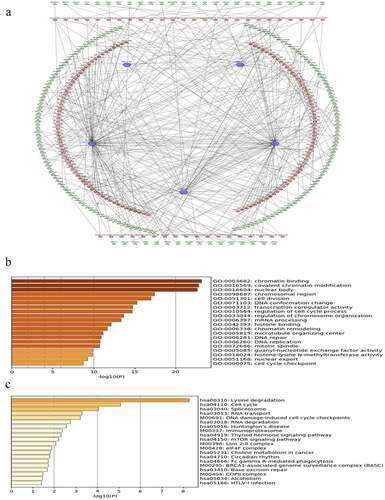
Table 1. The top 10 OC-related small molecules with highly significant correlations in the results of CMap