Figures & data
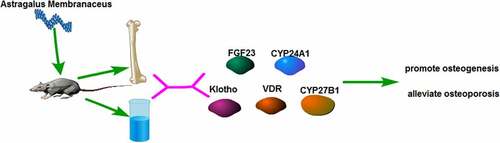
Figure 1. Detection of femur bone structure in mice by Micro-CT A-F showed in different treatment groups. A, SAMR1 group (normal control); B, SAMP6 group (negative control); C, SAMP6 + low dose AR group; D, SAMP6 + medium dose AR group; E, SAMP6 + high dose AR group; F, SAMP6 + VD (positive control)
Figure 2. AR increases bone density and bone microstructure in SAMP6 mice. A, Bone mineral density test results of the SAMR1, SAMP6, SAMP6 + low dose AR, SAMP6 + medium dose AR, SAMP6 + high dose AR, and SAMP6 + VD groups; B, Bone microstructure test results of the SAMR1 group, SAMP6 group, SAMP6 + low dose AR group, SAMP6 + medium dose AR group, SAMP6 + high dose AR group, and SAMP6 + VD group. *P < 0.05, **P < 0.01, Compared with the normal group; #P < 0.05, ##P < 0.01, Compare with the model group. n = 5
Table 1. The structural mechanical parameters of the femur
Table 2. The material mechanical parameters of the femur
Figure 3. AR increases the contents of calcium and phosphorus in the femur of SAMP6 mice. A, Calcium content detection results of the SAMR1 group, SAMP6 group, SAMP6 + low dose AR group, SAMP6 + medium dose AR group, SAMP6 + high dose AR group, and SAMP6 + VD group; B, Phosphorus content detection results of the SAMR1 group, SAMP6 group, SAMP6 + low dose AR group, SAMP6 + medium dose AR group, SAMP6 + high dose AR group, and SAMP6 + VD group. *P < 0.05, **P < 0.01, Compared with the normal group; #P < 0.05, ##P < 0.01, Compare with the model group. n = 5
Figure 4. AR regulates the gene and protein expressions of FGF23, Klotho, VDR, CYP27B1, CYP24A1, and BGP. A-E, Detection of mRNA expression levels of FGF23, Klotho, VDR, CYP27B1, CYP24A1, and BGP by q-PCR; F, Detection of protein expression levels of FGF23, Klotho, VDR, CYP27B1, CYP24A1 and BGP by WB; G, Grayscale value of WB. *P < 0.05, **P < 0.01, Compared with the normal group; #P < 0.05, ##P < 0.01, Compared with the model group. n = 5
Figure 5. AR increases the content of FGF23 and Klotho. A, Detection of the expression of FGF23 in blood by ELISA; B, Detection of the expression of Klotho in blood by ELISA. *P < 0.05, **P < 0.01, Compared with the normal group; #P < 0.05, ##P < 0.01, Compared with the model group. n = 5