
Figures & data
Figure 1. (a) Volcano plots of DE-miRNAs. (b) Heatmap of DE-miRNAs
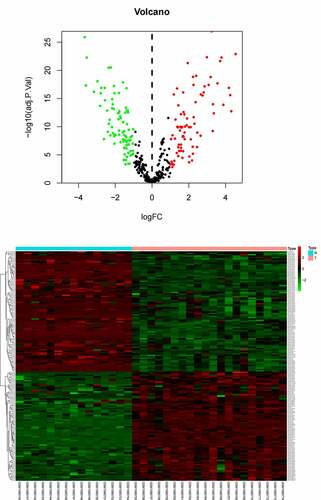
Figure 2. (a) Volcano plots of DE-mRNAs. (b) Heatmap of DE-mRNAs
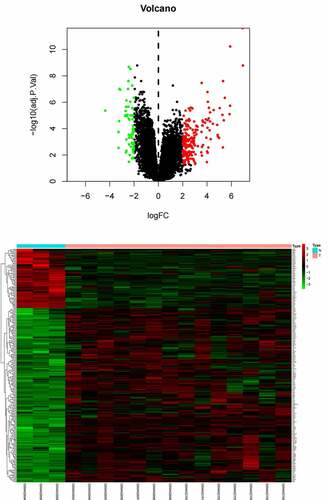
Table 1A. The table shows the information of Top 20 differentially expressed miRNAs
Table 1B. The table shows the information of Top 20 differentially expressed mRNAs
Figure 3. (a) Top 10 TF of up-regulated DE-miRNAs. (b) Top 10 TF of down-regulated DE-miRNAs
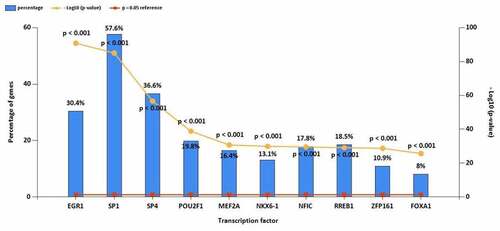
Figure 3. Continued
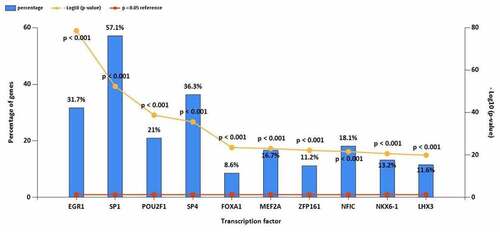
Table 2. The table shows the information of intersection genes
Figure 4. (a) Venn diagram of common differentially expressed genes from the two datasets. DE-mRNAs were down-regulated in the dataset. (b) Venn diagram of common differentially expressed genes from the two datasets. DE-mRNAs were up-regulated in the dataset
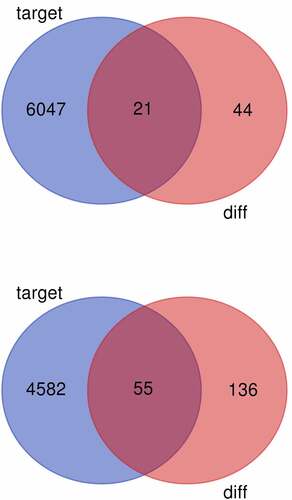
Figure 5. (a) GO functional annotation of 76 dysregulated mRNAs. Top 10 GO terms of 76 dysregulated mRNAs in three categories (CC, BP, MF). (b) GO functional annotation of 76 dysregulated mRNAs. Top GO terms and their enriched mRNAs. (c) KEGG pathway enrichment analysis of 76 dysregulated mRNAs. Top 10 KEGG enrichment pathways of 76 dysregulated mRNAs. (d) KEGG pathway enrichment analysis of 76 dysregulated mRNAs. Top 10 KEGG enrichment pathways and their enriched mRNAs
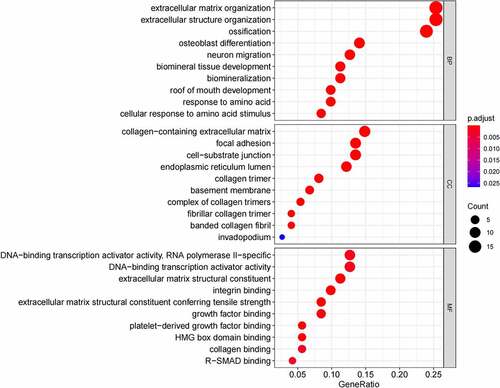
Figure 5. Continued
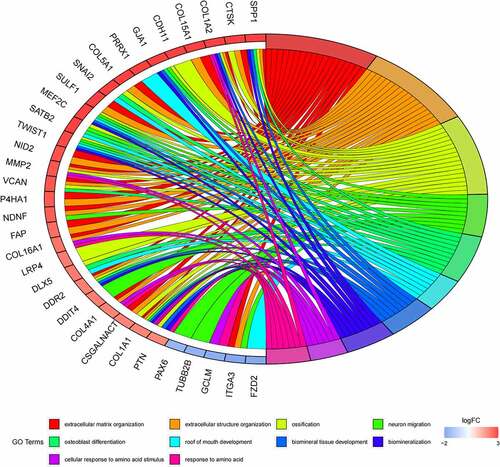
Figure 5. Continued
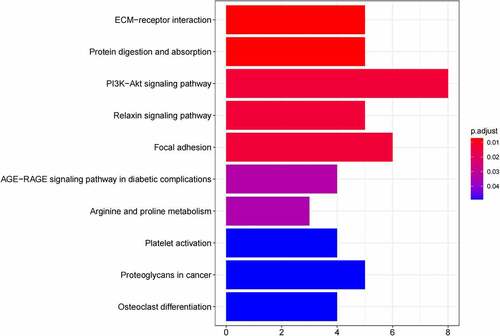
Figure 5. Continued
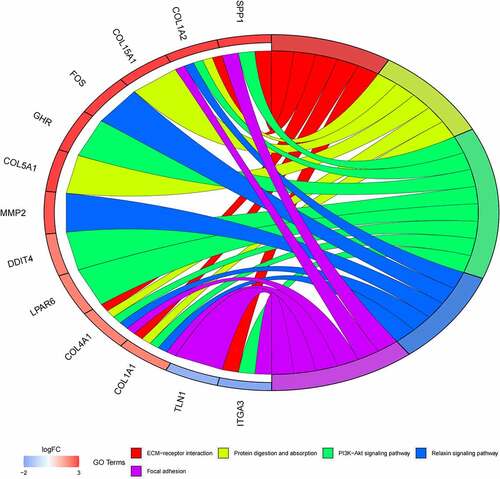
Figure 6. (a) GO functional annotation of 55 up-regulated mRNAs. Top 10 GO terms of 55 up-regulated mRNAs in three categories (CC, BP, MF). (b) GO functional annotation of 55 up-regulated mRNAs. Top GO terms and their enriched mRNAs. (c) KEGG pathway enrichment analysis of 55 up-regulated. Top 10 KEGG enrichment pathways of 55 up-regulated mRNAs. (d) KEGG pathway enrichment analysis of 55 up-regulated mRNAs. Top 10 KEGG enrichment pathways and their enriched mRNAs
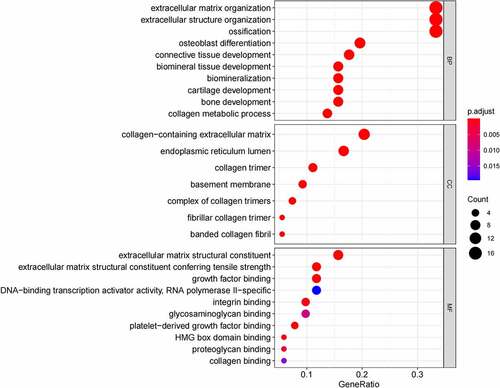
Figure 6. Continued
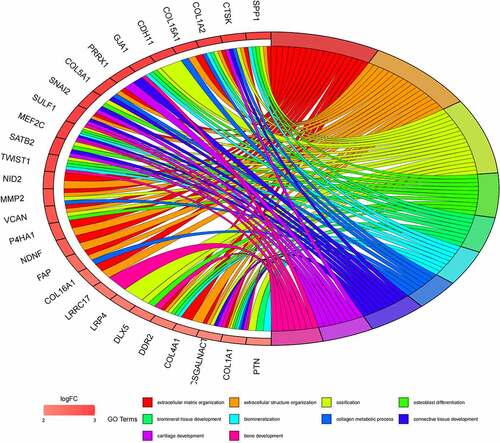
Figure 6. Continued
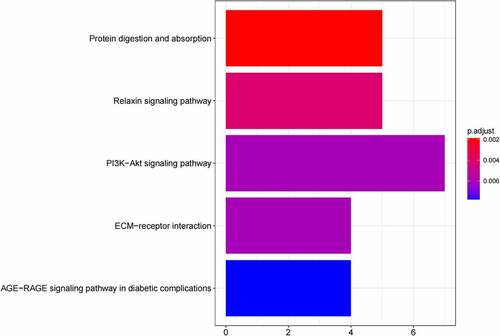
Figure 6. Continued
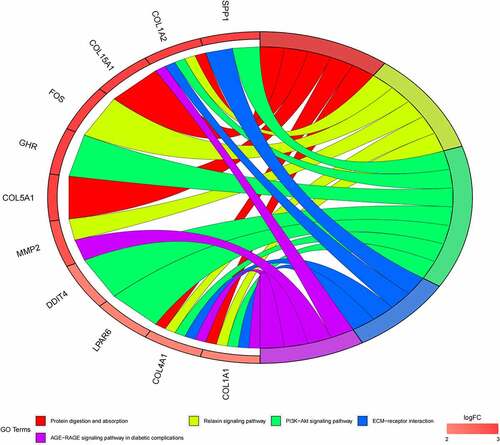
Figure 7. (a) GO functional annotation of 21 down-regulated mRNAs. Top 10 GO terms of 21 down-regulated mRNAs in three categories (CC, BP, MF). (b) GO functional annotation of 21 down-regulated mRNAs. Top GO terms and their enriched mRNAs
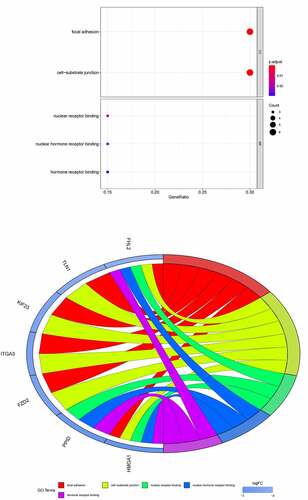
Figure 8. (a) The miRNA–mRNA networks of all dysregulated mRNAs. (b) The miRNA–mRNA networks of up-regulated mRNAs. (c) The miRNA–mRNA networks of down-regulated mRNAs
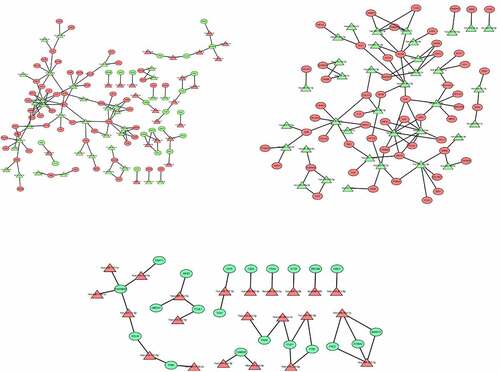
Figure 9. (a) PPI network of all dysregulated mRNAs. (b) PPI network of up-regulated mRNAs. (c) PPI network of down-regulated mRNAs
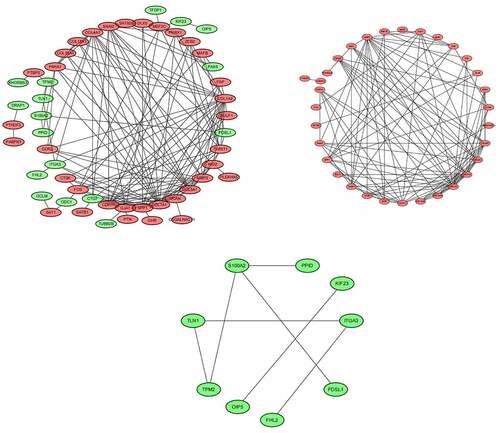
Table 3. The table shows the information of hub miRNAs
Table 4. The table shows the information of hub mRNAs, the information of hub mRNAs