
Figures & data
Figure 1. Multi-omics landscape of circadian rhythm pathway in glioma. (a). Multi-omics alteration of circadian rhythm pathway in LGG and GBM. Row: from top to bottom: clinical annotation, mutation and expression profile. Column: left: LGG subgroup, right: GBM subgroup; (b). Comparisons of sample subtypes, somatic alteration of 1p and 19q between patients with altered circadian rhythm pathway in LGG (upper) and GBM (lower); (c). Mutation and copy number alteration frequencies between patients with altered circadian rhythm pathway in LGG (upper) and GBM (lower); (d). Survival analysis between patients with altered circadian rhythm pathway in LGG (upper) and GBM (lower)
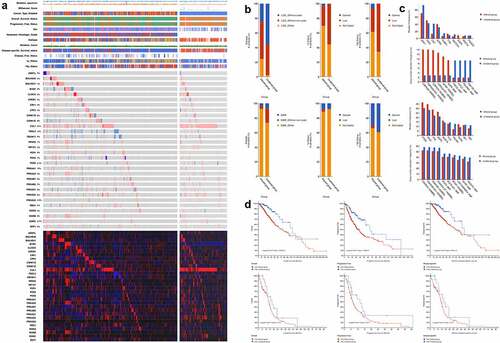
Figure 2. Differential analyses between patients with altered and unaltered circadian rhythm pathway as well as LGG and GBM patients. (a). Venn plot of differential-expressed genes between patients with altered and unaltered circadian rhythm pathway. (b). Differential- expressed genes between LGG and GBM patients identified using robust rank aggregation (RRA) with integrative evaluation of mRNA and protein expression; (c). Protein-protein interactions between DEGs in LGG and GBM patients; (d). Gene oncology enrichments between LGG and GBM patients
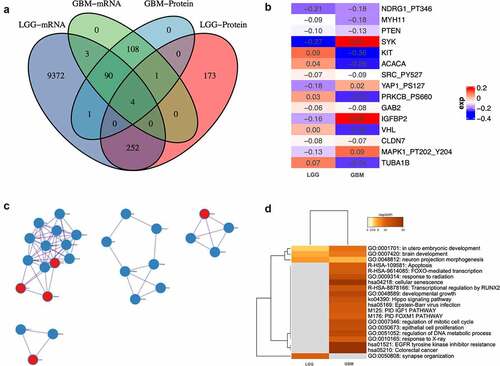
Figure 3. Expression profile of circadian rhythm pathway index and pathway genes. (a). Heatmap showing the expression profile of circadian rhythm pathway index and pathway genes. Patients were ranked by circadian rhythm pathway index from 0 to 1. Genes expressions were zero-centered. (b). Expression profile of circadian rhythm pathway index and pathway genes was shown with patients divided by sample group. (c). Correlations between circadian rhythm pathway index and pathway genes. Correlation R value was shown as the inner line, with green as negative correlation and red as positive
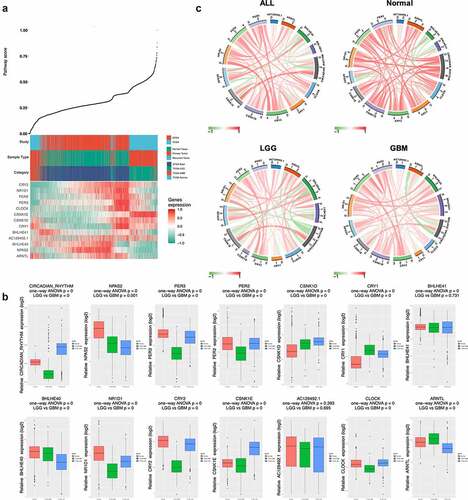
Figure 4. Survival analyses of circadian rhythm pathway index and pathway genes. (a). Forest plots showing the survival analyses results of circadian rhythm pathway index and pathway genes in all glioma patients and LGG and GBM subgroup, respectively. Hazard Ratio and 95% CI was show as the line colored by P value. (b). KM plot of circadian rhythm pathway index in all glioma patients and LGG and GBM subgroup, respectively. Red: high expression group; Green: low expression group. P value was log-ranked. (c). KM plot of BHLHE40 in all glioma patients and LGG and GBM subgroup, respectively. Red: high expression group; Green: low expression group. P value was log-ranked
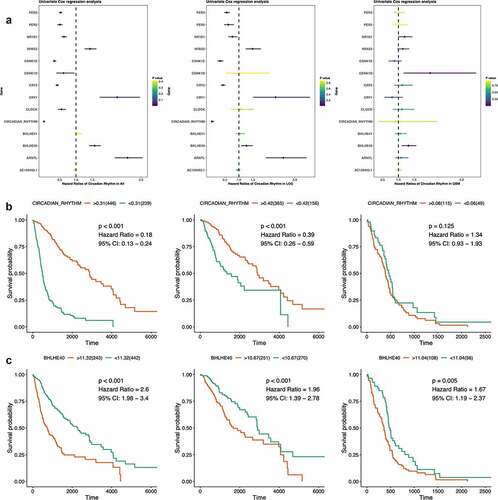
Figure 5. Clinical significance of circadian rhythm pathway index in LGG. Expression profile and subgroup survival analyses were done with patients divided by clinical characteristics. The expression profile was show as dot and line, representing the Median and interquartile range, while the survival analysis representing the Hazard Ratio and 95% CI. The sample size was represented as dot size and all P value < 0.05 was emphasized and considered significant
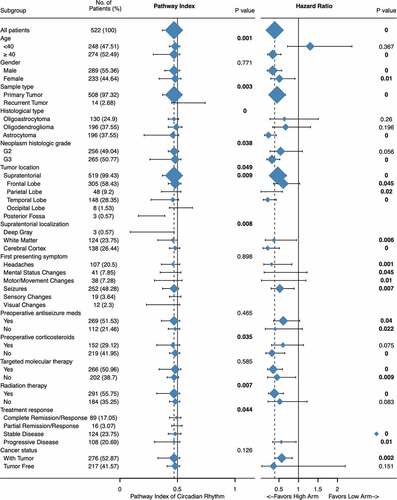
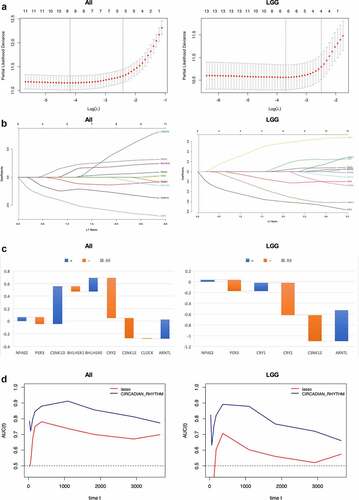
Figure 6. Prognostic value of circadian rhythm pathway index in glioma and LGG subgroup. (a). Cvfit plot for the selection of lambda value selection. The minimal lambda values were used for the construction of gene index. (b). LASSO regression of all 13 circadian rhythm pathway genes. (c). The gene index generated from LASSO regression. Orange: positive gene index; Blue: negative gene index. (d). TimeROC plot comparing the prognostic value of circadian rhythm pathway index and the LASSO regression index. Time points selected including 0, 30, 60, 120, 180, 365, 1095, 1825, 2920, 3650 days
Supplemental Material
Download ()Data availability statement
The datasets generated and/or analysed during the current study are available in the UCSC XENA repository, [https://tcga.xenahubs.net]. Data used included the Cancer Genome Atlas (TCGA, http://can‑cergenome.nih.gov/), the GTEx projects.